Create: Inventory Fixed Report
Estimated reading time: 9 minutesOverview
In this page, you will go through the process of building a fixed Inventory report from scratch using the ReportFixed() function.
If you are following the Training Labs, this is Lab 3.3. Note: The Report Library at Training Labs for this lab will be blank as you are creating a report from a new blank Excel sheet.
Building the Report
Step 1: Begin like you did when creating the Customer Aging report, with the Interject Report Builder. It is where you select the Data Portal that is needed for this particular report.
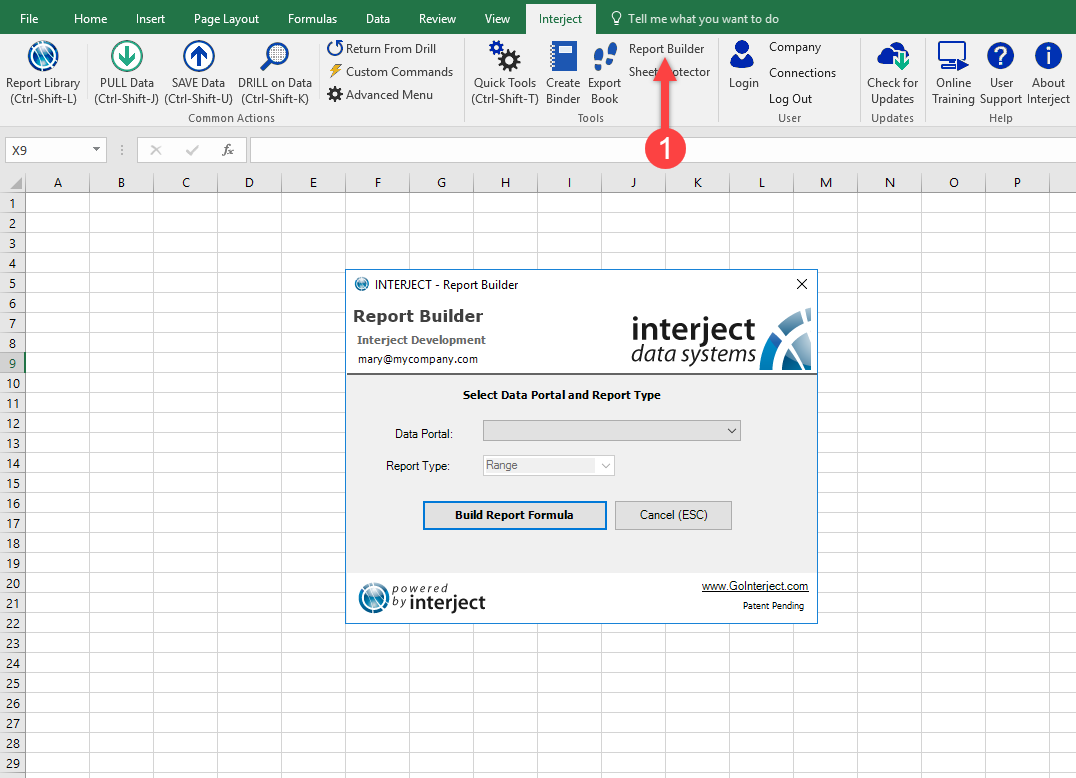
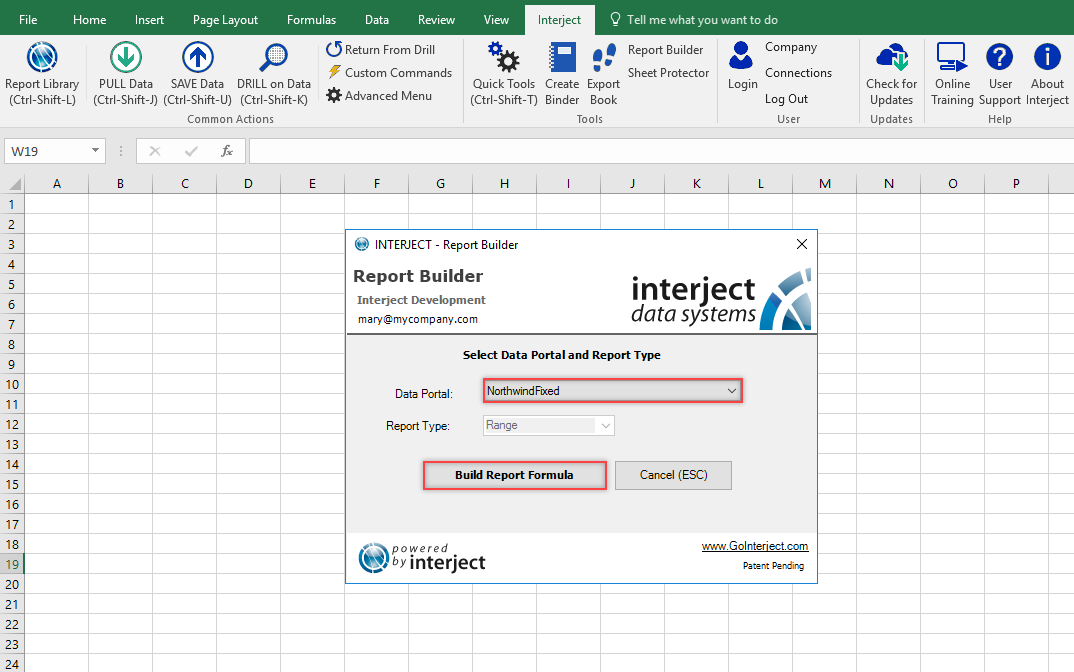
Step 2: For this Inventory report, choose the NorthwindFixed Data Portal and click Build Report Formula.
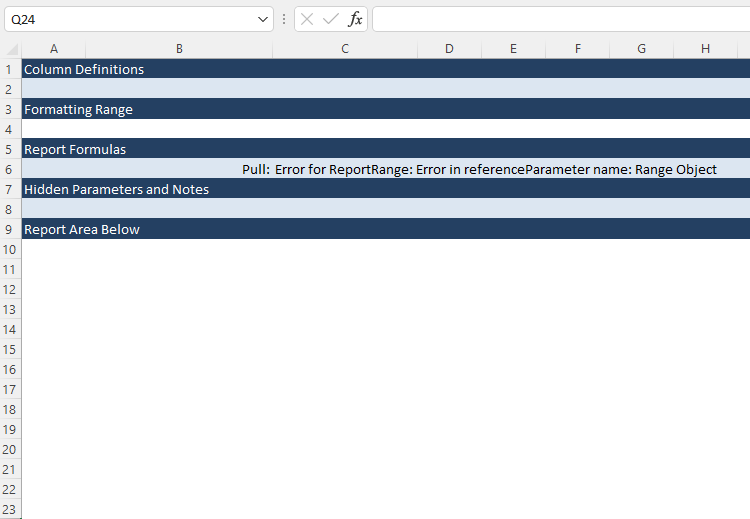
After the report is built, it will look like the one below. There are no parameters involved with this report, so none are listed after row 14.

Delete rows 11 through 24 since they are not needed for this lesson. The page should look as illustrated below.
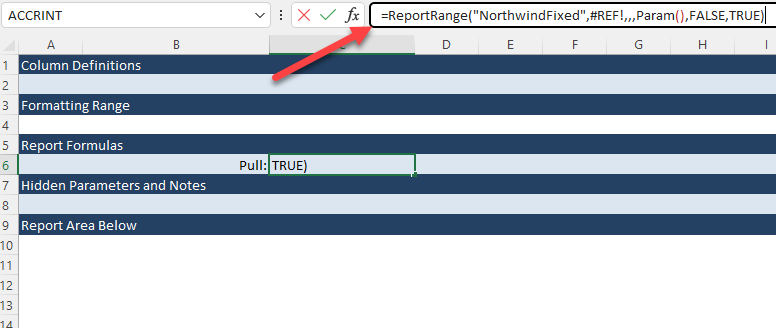
Step 3: Because ReportRange() is the most used pull function, the report builder builds one automatically. However, in this report you will be using the ReportFixed() function. Clear the ReportRange function in cell C6.
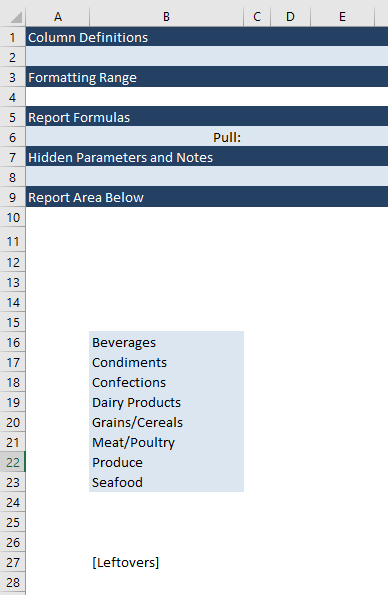
Step 4: A fixed report requires specific values to be entered in a row definition column. Enter the following categories as seen below. In cell B27, you also added a Leftovers section that is a special Interject feature, a Row Definition marking the start of a section that will include any data not matching the earlier fixed rows. This is helpful in ensuring all data is presented.
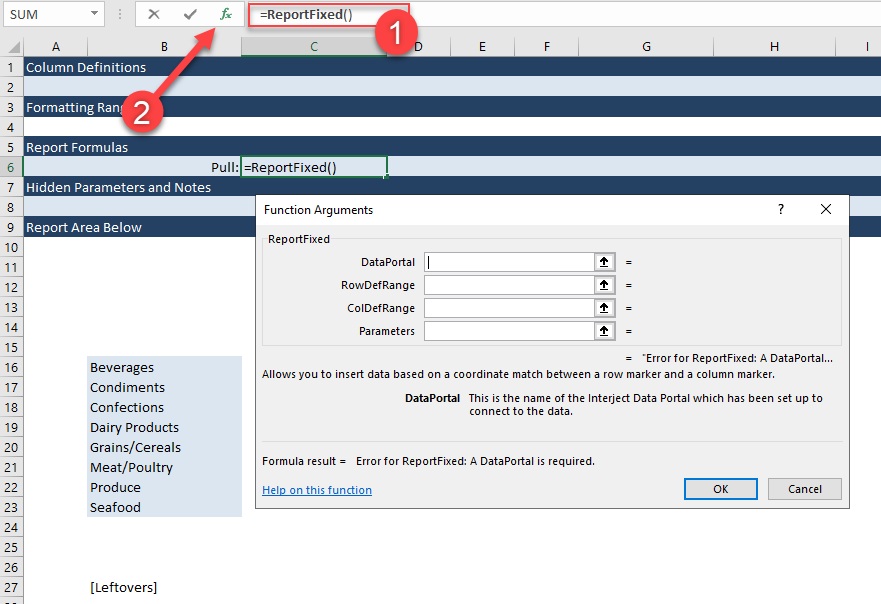
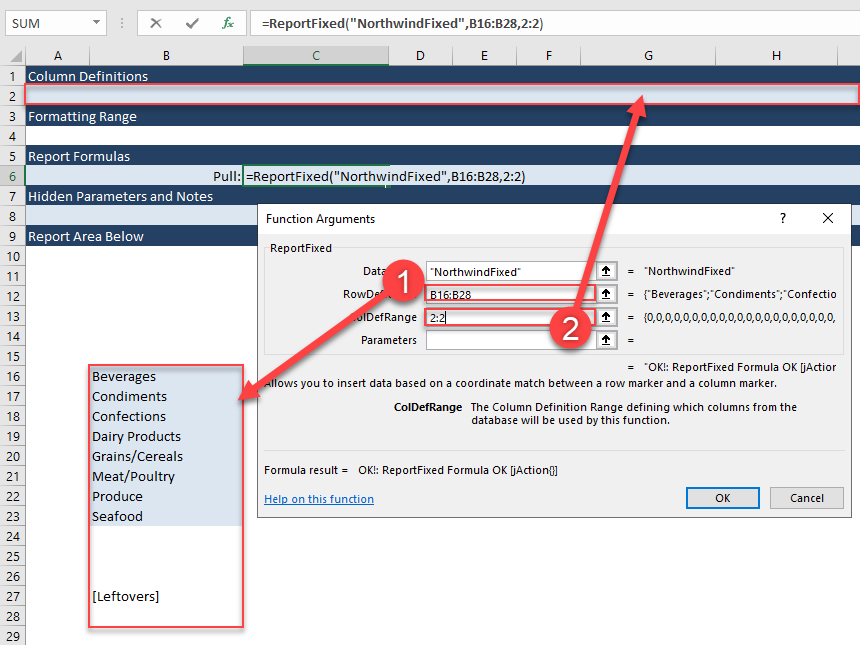
Step 5: In C6, type =ReportFixed(), then click the fx button to bring up the Function Wizard as shown below.
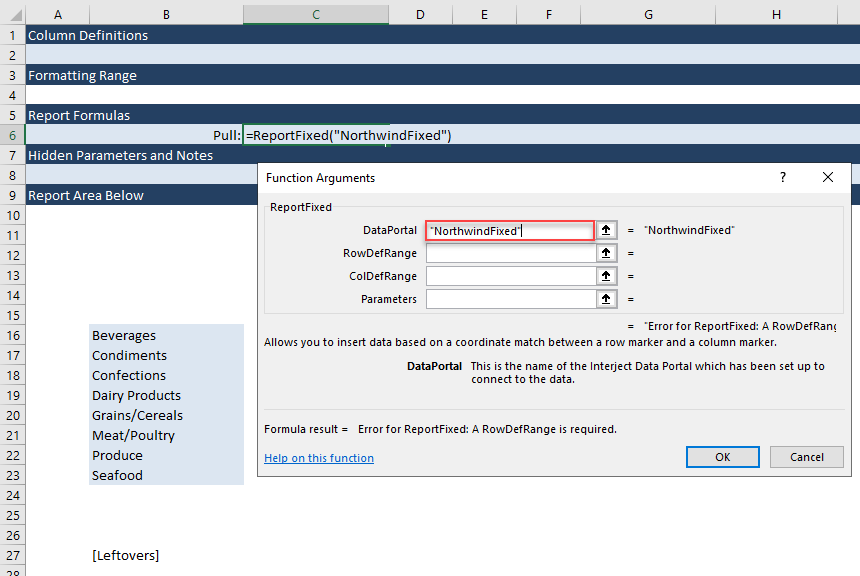
In order to bring in the correct data you will need to designate a Data Portal. The Data Portal for this example is NorthwindFixed.
Step 6: In a ReportFixed function you need to define the Column Definition and Row Definition ranges. Using the Function Wizard, use B16:B28 for the RowDefRange . For Column Definitions, use row 2 by typing 2:2 in the ColDefRange argument.
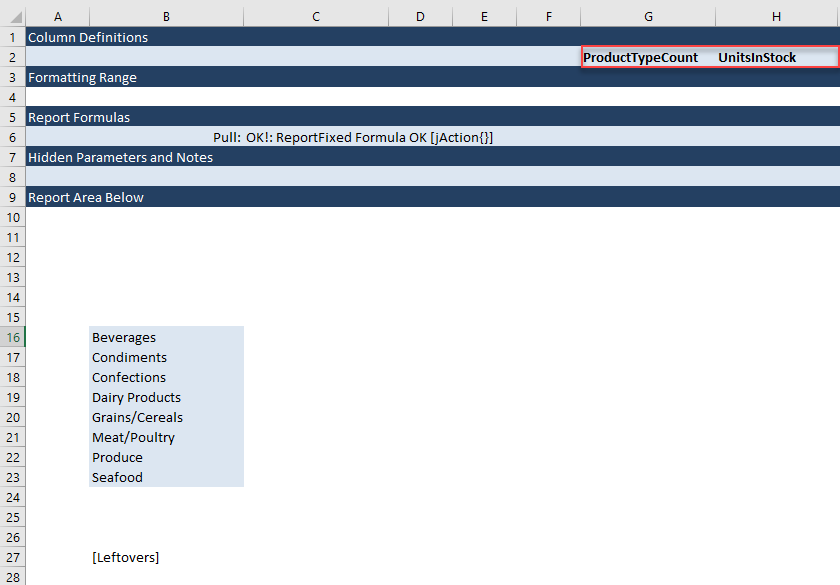
Step 7: Now define the Column Definitions that are available in the Data Portal. Type ProductTypeCount in G2 and UnitsInStock in H2.
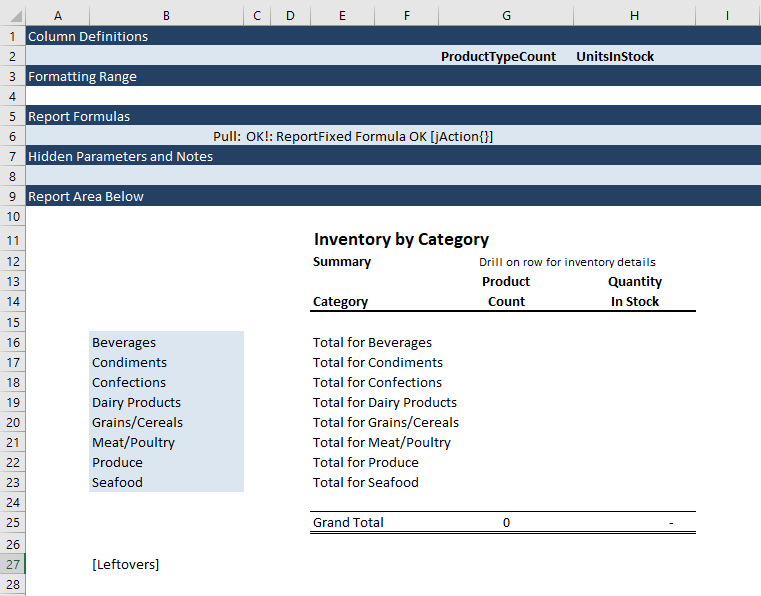
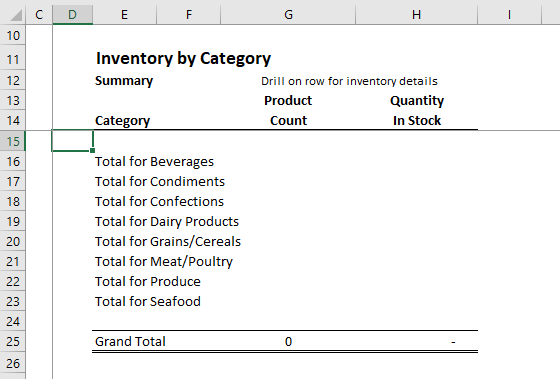
Step 8: In this step, add column labels, report titles, borders, and subtotals. Change the report to match.
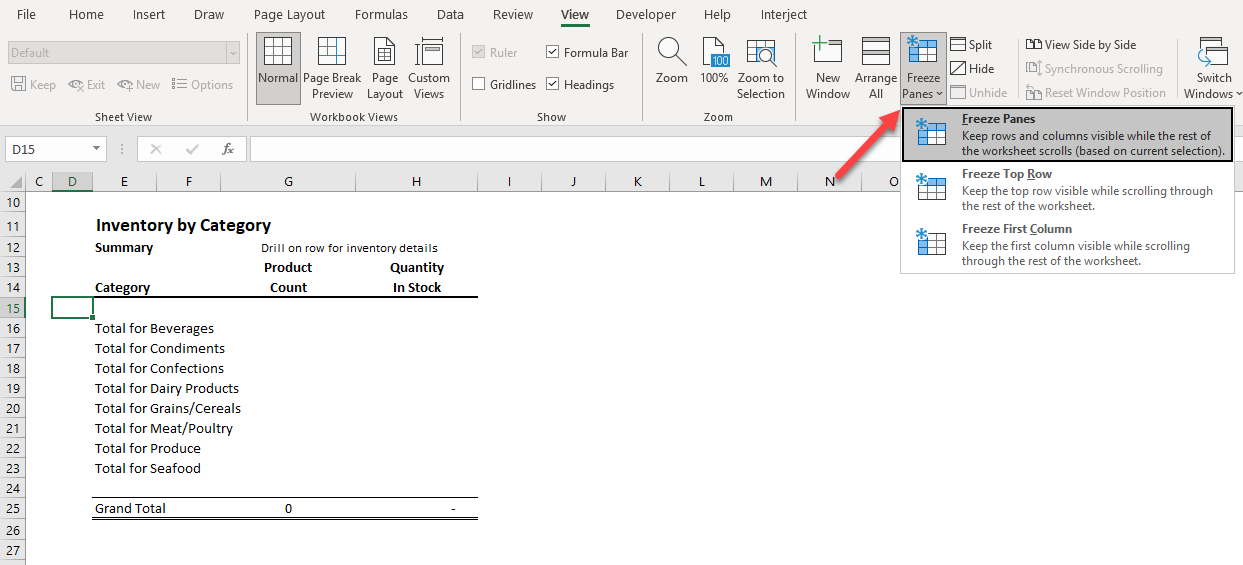
Step 9: Freeze the report panes so that just the report area is shown for users. In previous examples jFreezePanes() functions were used, but in this page use the standard Freeze Panes feature in Excel. Adjust the worksheet's vertical and horizontal scroll bars until the report is positioned like below. Select cell D15 and use the View menu to set Freeze Panes as seen below.
The final product should look similar to the example below.
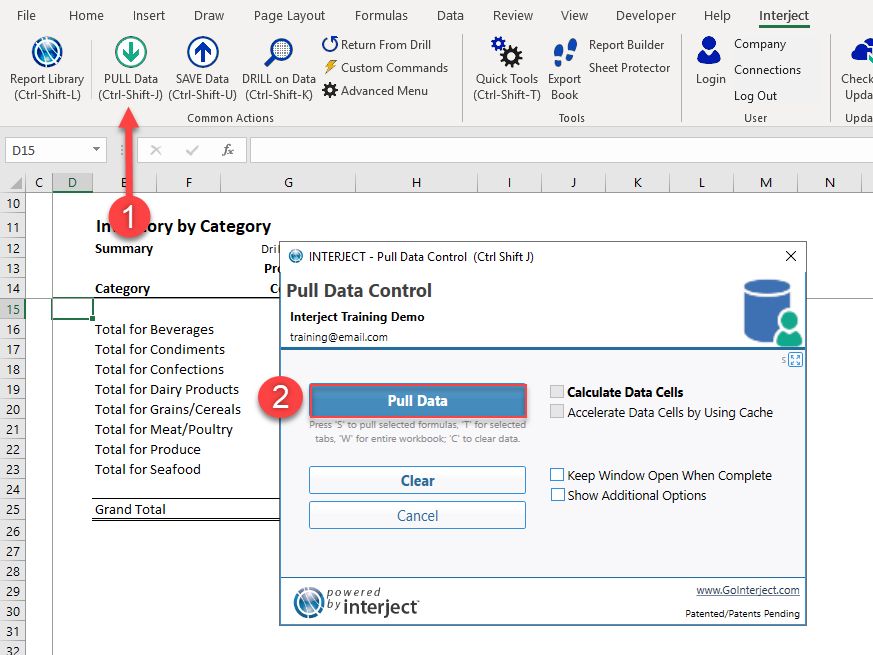
Step 10: Now select Pull Data to view the data in the report.
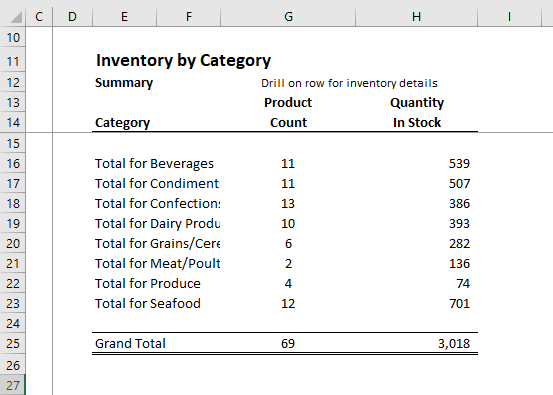
Your final data pull should look like this. You may need to do additional formatting to match the output.
Setting up Run on Open
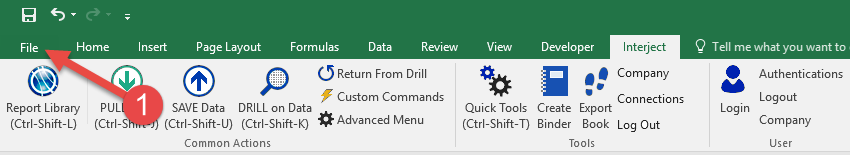
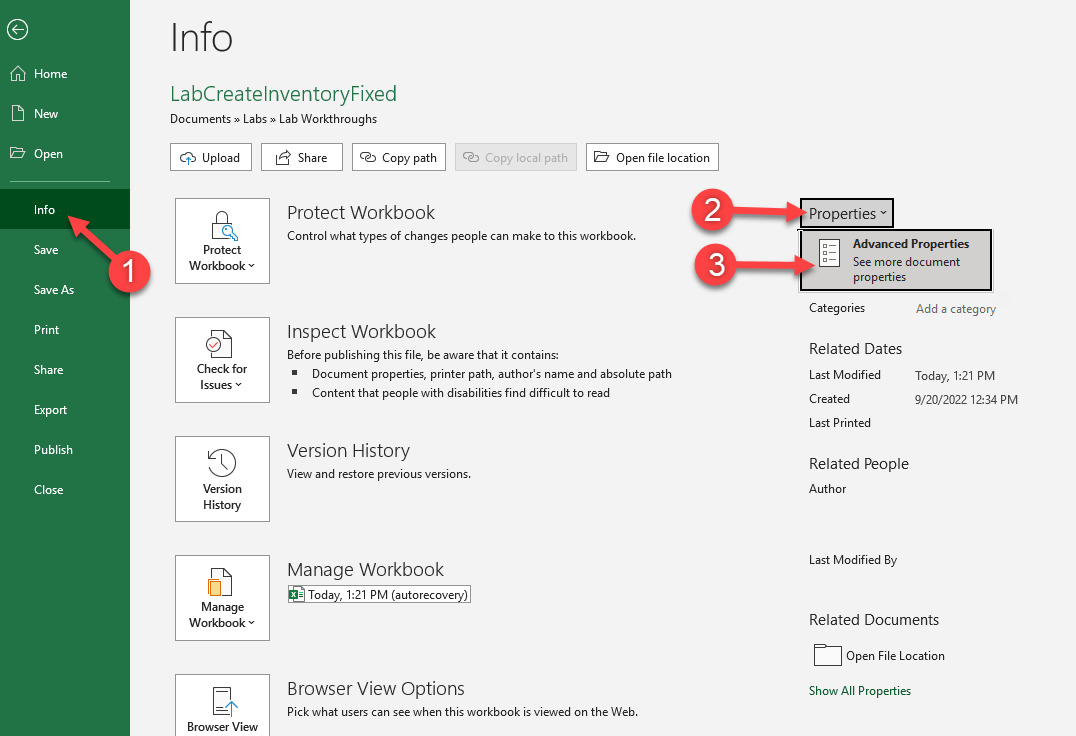
Step 1 Click on File in the Excel Ribbon to bring up the file screen.
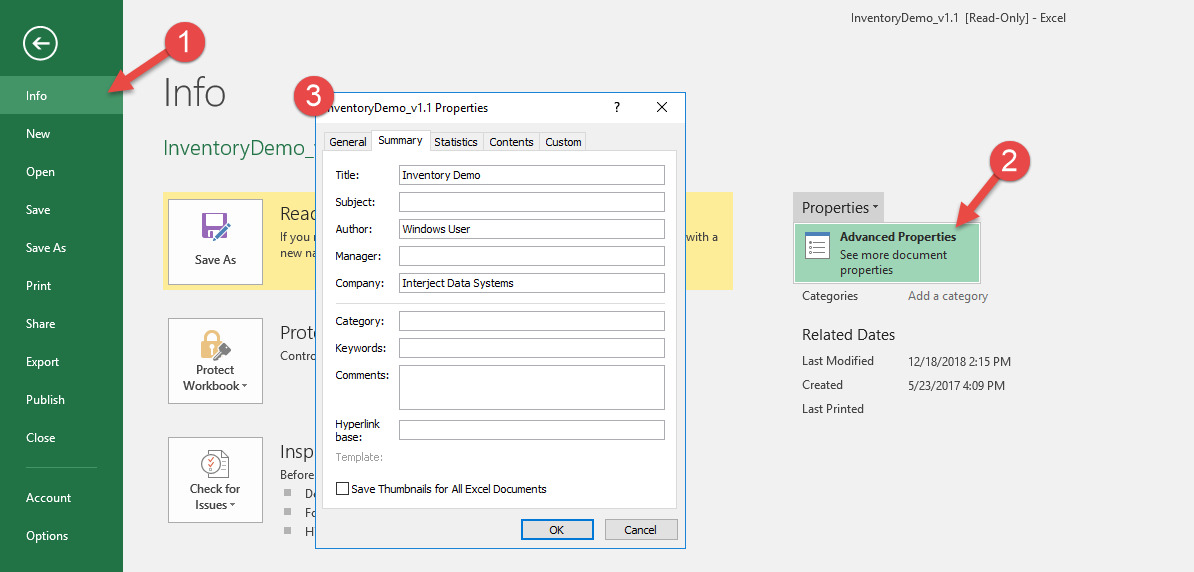
Step 2 Under Info, select Advanced Properties in the Properties dropdown. The Properties window will open.
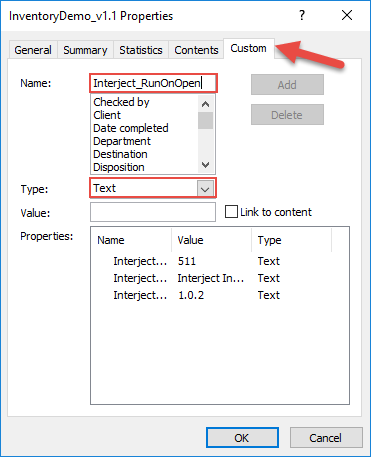
Step 3 Under the Custom tab find the Name textbox and type Interject_RunOnOpen. The Type field should be Text.
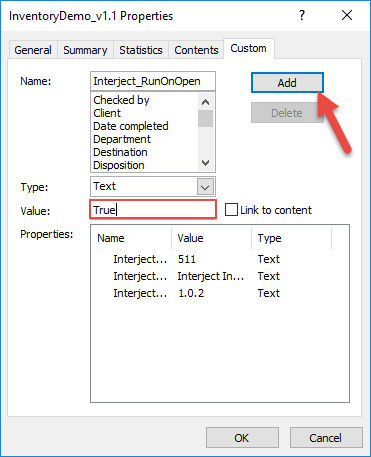
Step 4 The Value box below takes two options: True or T:TabName True will will cause Excel to run on the first tab seen on open. Specify the tab name to default to that tab.
Option 1 If you would like to run on the first tab seen, set value to True and click Add.
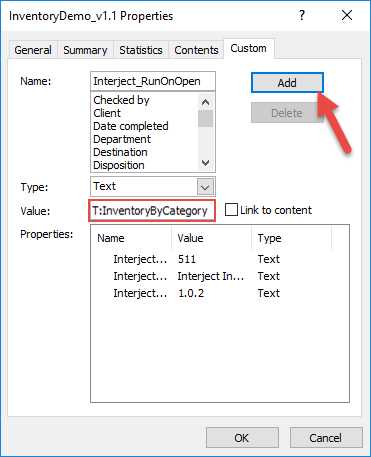
Option 2 If you would like to run on a specific tab, set the value to T:TabName and click Add.
In this case, we want to pull CustomerAging on open, so type T:InventoryByCategory and that tab will be pulled.
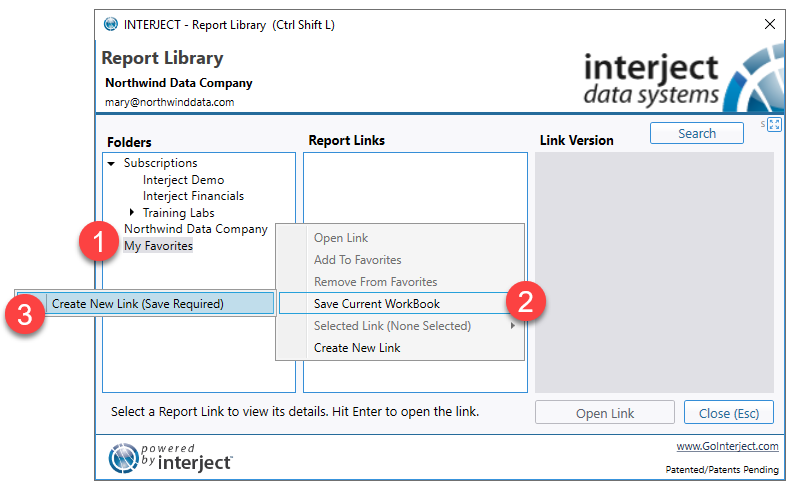
Step 5 Save the file to the Report Library "My Favorites" folder. (For detailed instructions on how to save a file to the Report Library, see here.)
Step 6 Close and reopen the file through the Report Library, and Excel will auto-pull the report.
For a full guide using a different report, refer to the Run on Open Example.
jWorkbookProperty()
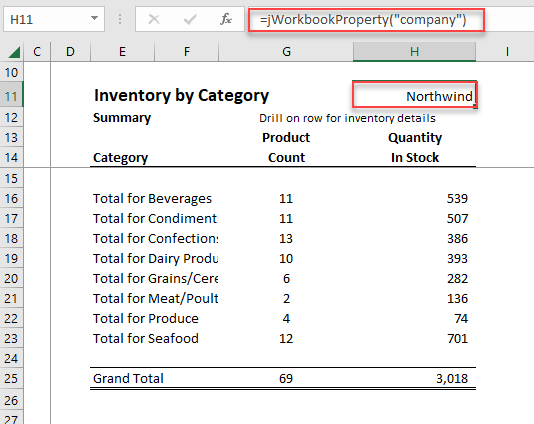
Finally, we will add a finishing touch with the jWorkbookProperty() function. This function pulls information saved in the Excel file properties into the report. To start, click on File on the top menu and then click Info, Properties, and then Advanced Properties.
Enter some details into the Properties window.
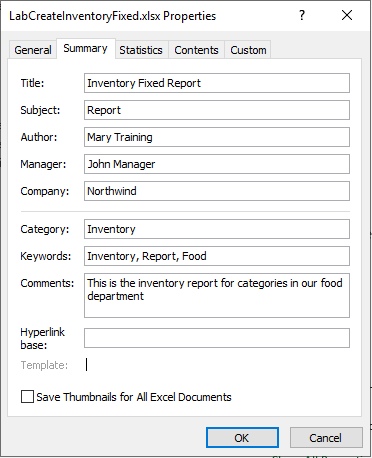
In cell H11 enter =jWorkbookProperty("company") and see the results.