Financial Report
Estimated reading time: 17 minutesOverview
This lab is for controllers or accountants who work with financial data and spreadsheets. In this walkthrough, you will open a Profit and Loss (PL) Trend report and drill into the supporting detail from the general ledger detail. The Journal Entry (JE) Query report will provide you account level detail and will allow for drills further into each journal entry.
To watch a quick walkthrough video, click on the icon:
If you are following the Training Labs, this report file can be found in the Report Library at Training Labs > Lab 1 Real World Walkthroughs > Lab 1.3 Financial Report.
Navigating to the PLTrend Report
Step 1: Navigate to the PL Trend report page inside the Interject Financials folder of the Report Library. The Report Library is a central place for publishing reporting templates. It is versioned and easily located.
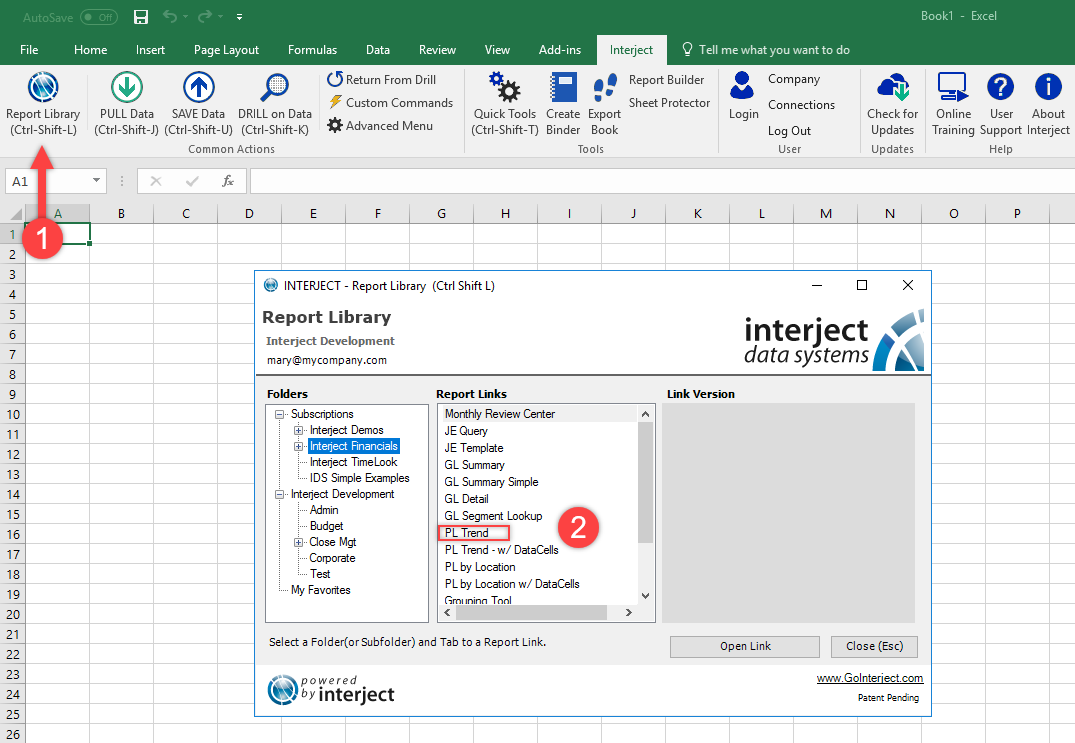
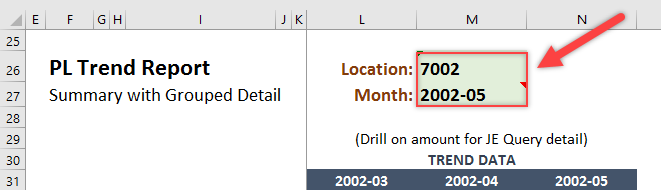
Step 2: With the report template open, type the location number, year, and the month of the report to view. Use 7002 for Location and 2002-05 (May 2002) for the year and month.
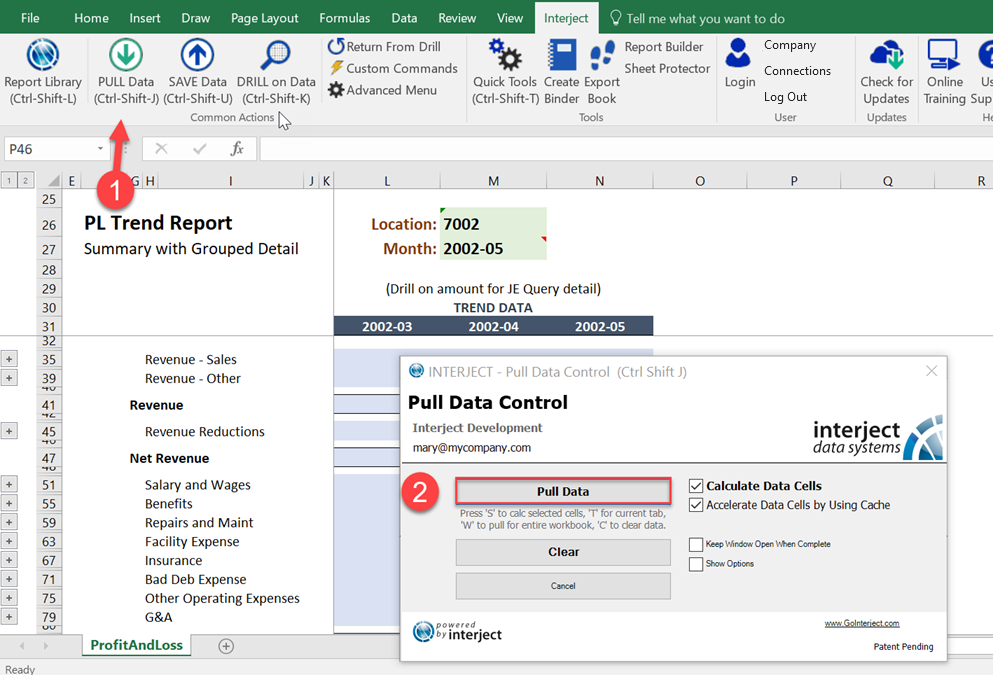
Now you are ready to pull the data. Use the Pull Data button as shown below, or use the short key Ctrl-Shift-J.
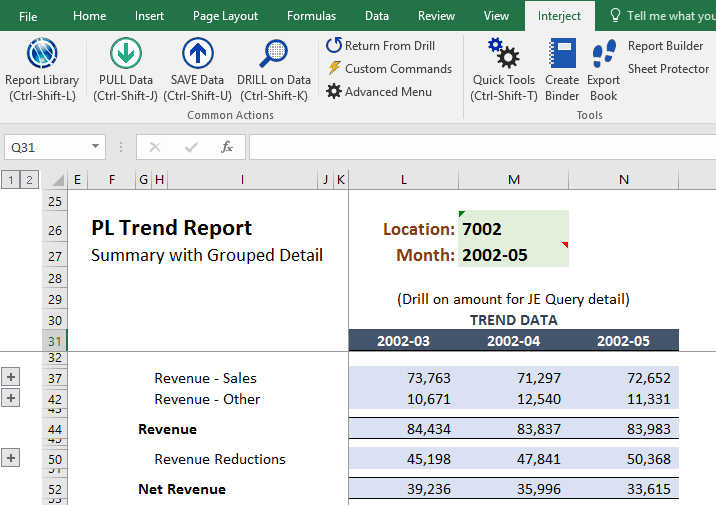
It will just take a moment for our report to populate. The illustration below shows the amounts for March, April, and May of 2002.
Modifying the Report
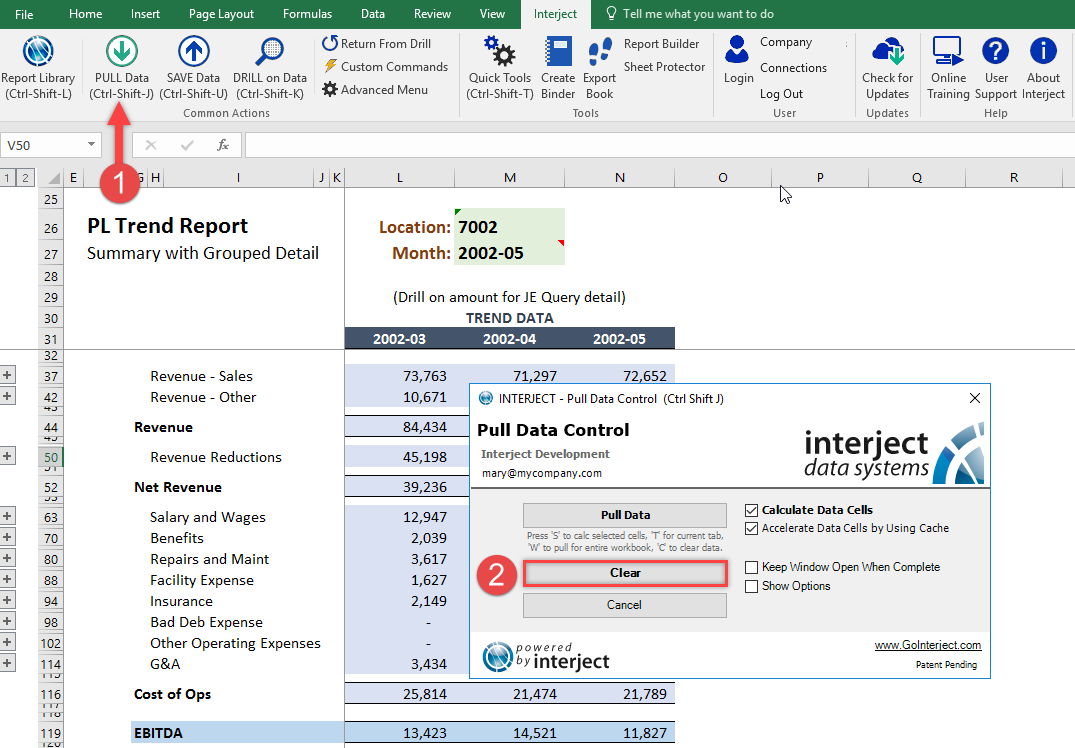
Step 1: Now quickly add a few more columns to the report for June, July, and August. First clear the data so you have an empty template. Clear the data by selecting the Pull Data button again, but this time choose the Clear button.
Step 2: Extend the trend out a few more months by selecting column N, clicking and holding the small square anchored on the bottom right of the header, and dragging it three columns to the right. Once released, the columns automatically expand. The below animated GIF illustrates this series of steps.
Step 3: Re-pull the data with the Pull Data menu button as you did earlier.
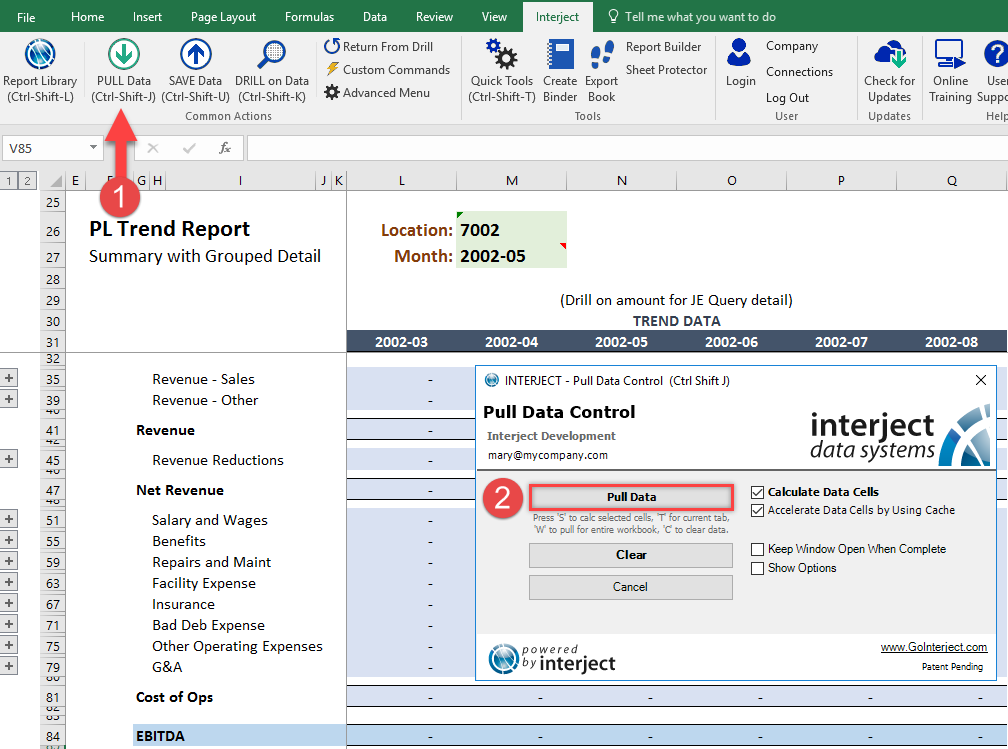
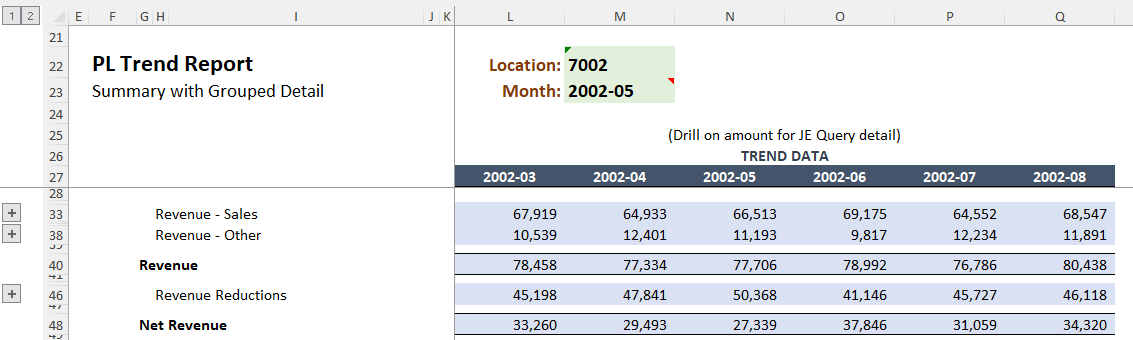
Once the update is completed, all six months of data will be shown and populated.
Grouped Detail in the Report
Interject allows for spreadsheet groupings within financial reports, so additional detail can be included and expanded when needed. The steps below will demonstrate how to expand grouped areas to view the account level detail included in this report.
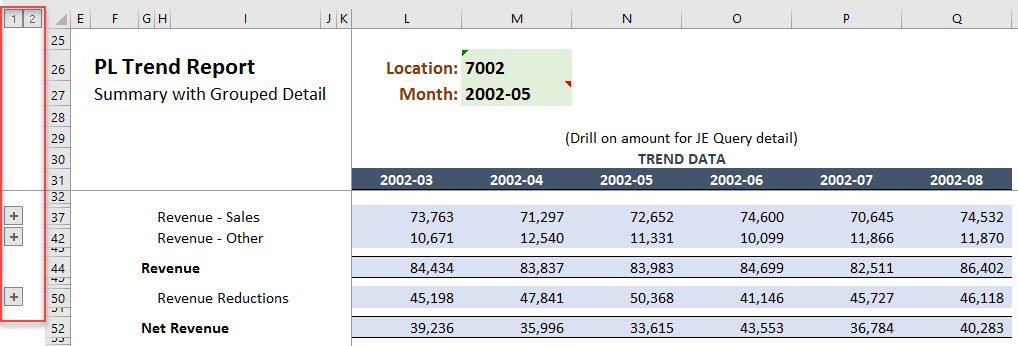
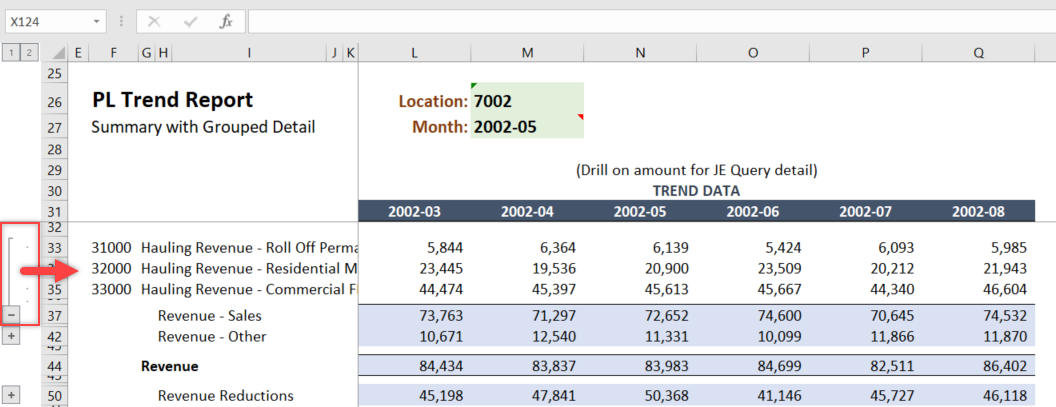
Step 1: Groupings are managed from the top and left margins of the spreadsheet. In this report, you are only using grouped rows so there are only +/- buttons on the left. Click the plus sign to expand a group and see the account detail.
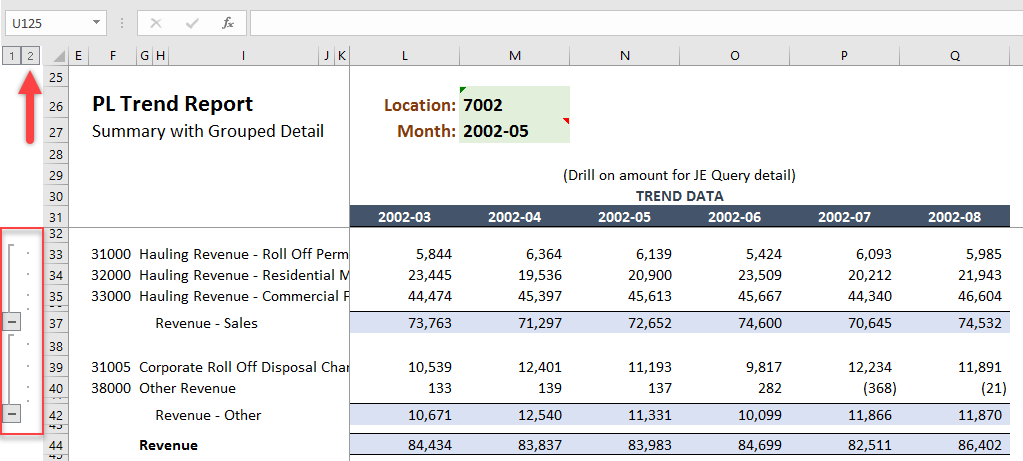
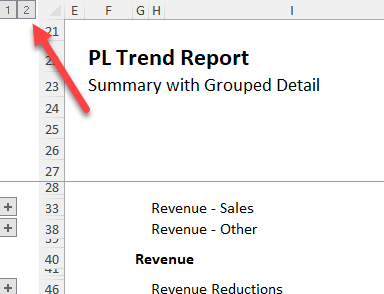
The previous example shows two groups expanded individually, but you can also expand all groups at one time. On the top left there is a sidebar with the numbers 1 and 2 on the top of the left margin.
Clicking 2 will expand all the groups at that level.
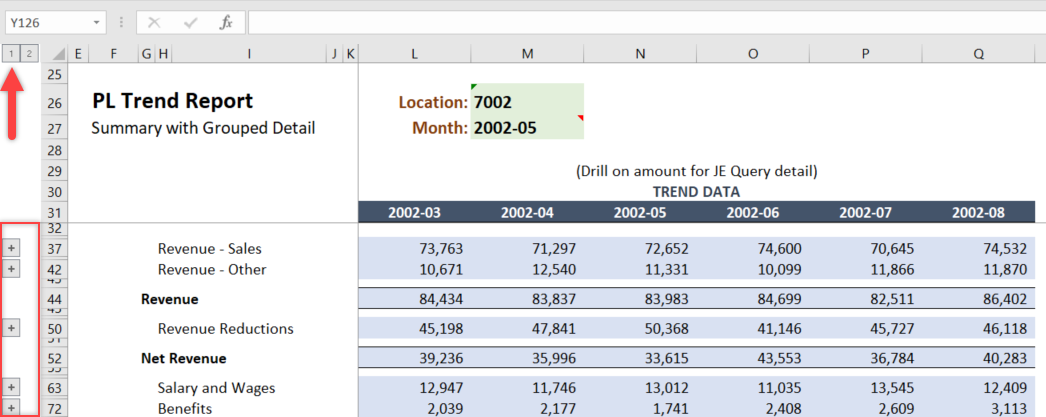
Clicking 1 will collapse all the groupings.
Drill to JE-Transaction
After expanding the groupings of modified the reports, you may still want more detailed information about a specific account. The Drill on Data feature allows us to pass information from one report to another for additional details.
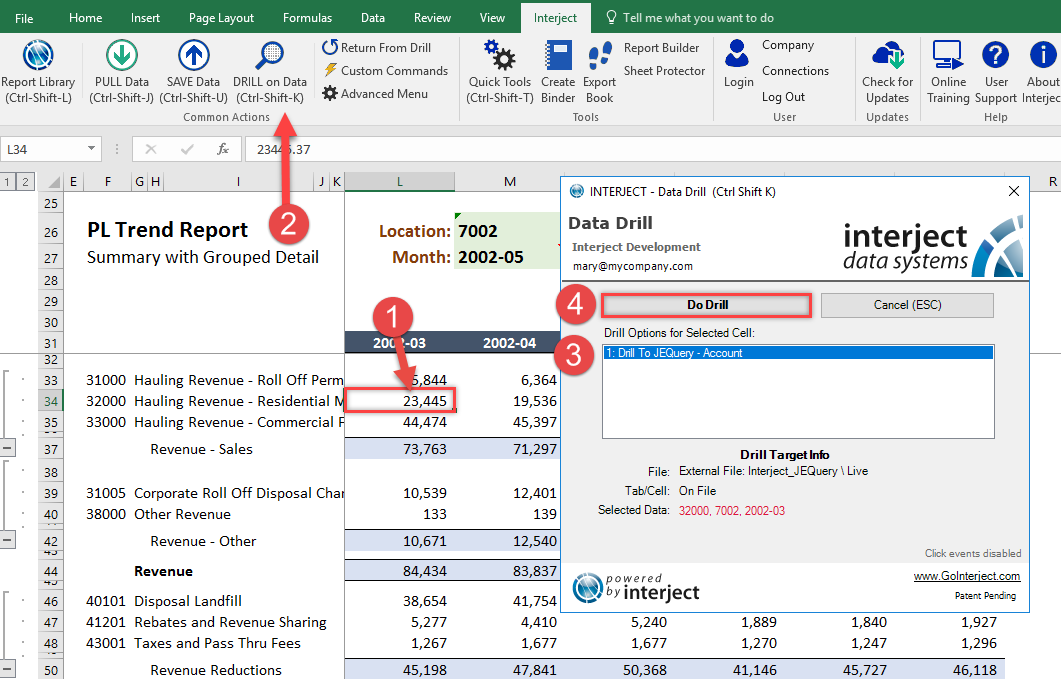
Step 1:
For example, drilling on any Trend Data value in account 32000 will take us to the JE Query report template which is a brand new workbook rather than another tab and will provide the line item detail. Try drilling on account 32000 for March 2003.
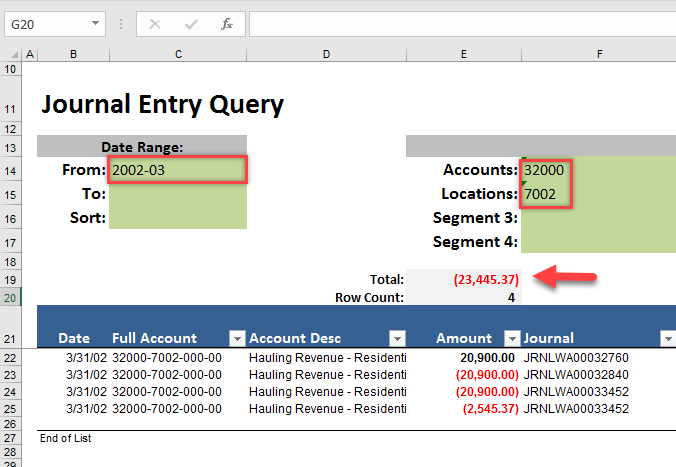
Step 2: A new report will open and automatically pull the underlying detail for the drill. The total will agree with the amount that was drilled on in L34 from the previous report. Notice the filters for the report were automatically populated from the report that you drilled from. The date range, account, and location all match.
Drill Further Into JE-Lookup
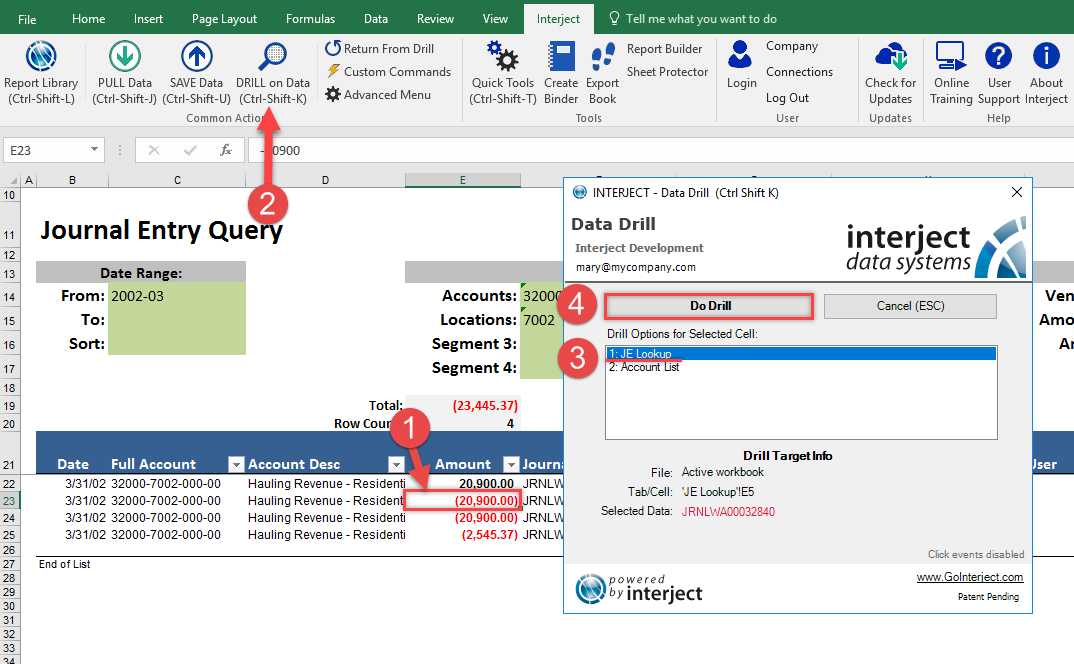
Lets go one step further. Now that you see the journal entry detail summing the account balance, pick a specific line and drill to view the complete journal entry JRNLWA00032840.
Step 1: Click on the first line that has a negative 20,900 value, on row 23. This line is from the journal entry JRNLWA00032840.
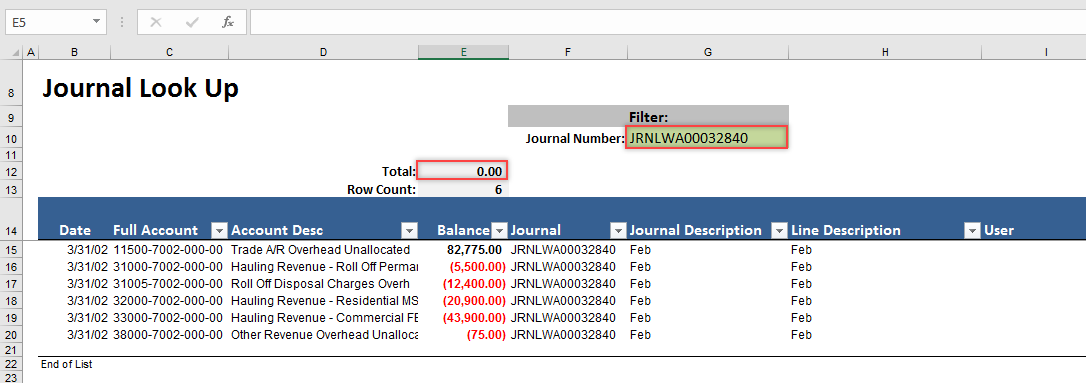
This drill goes directly to a second tab in the report called JE Lookup, and it will show the complete detail for journal entry JRNLWA00032760. As expected, it sums to zero like all journal entries must.
Report Example With Data Cells
The above examples illustrate the Interject Data List reports. These reports are structured by specifying what financial data goes into which column and row subtotals setup to show a specific group of accounts. Interject provides an alternate method to setting up reports so each worksheet cell can contain any value you need.
Step 1 : First expand the groups by clicking the "2" in the group management pane:
Step 2 : Now highlight all the rows below the "Revenue" section, right click on the section and delete the rows.
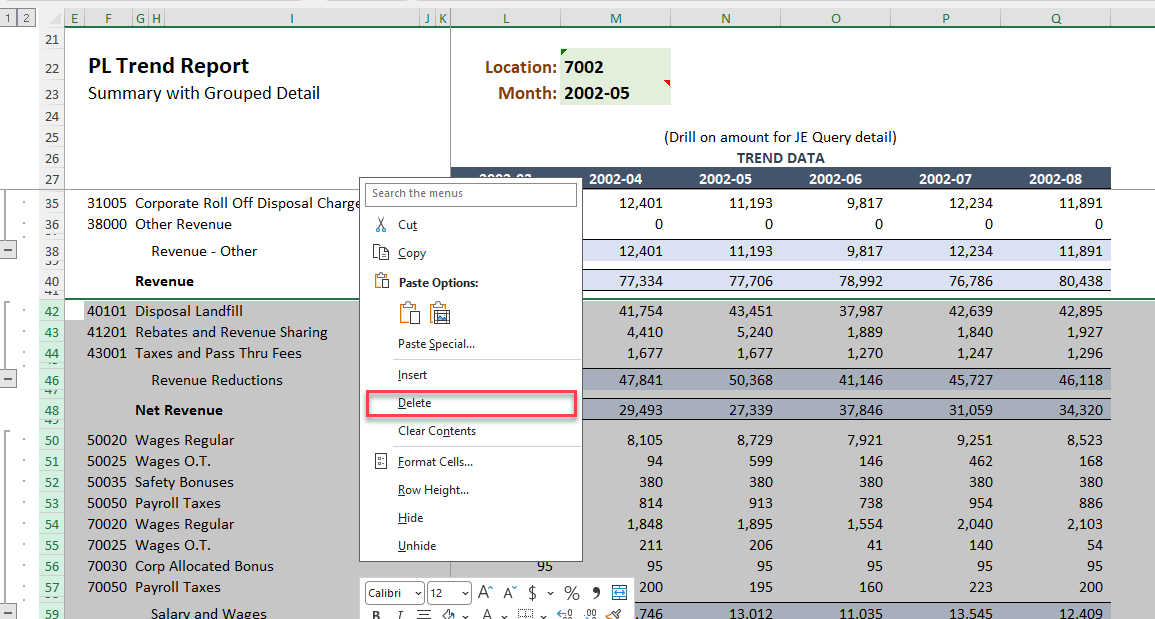
The report now looks like this.
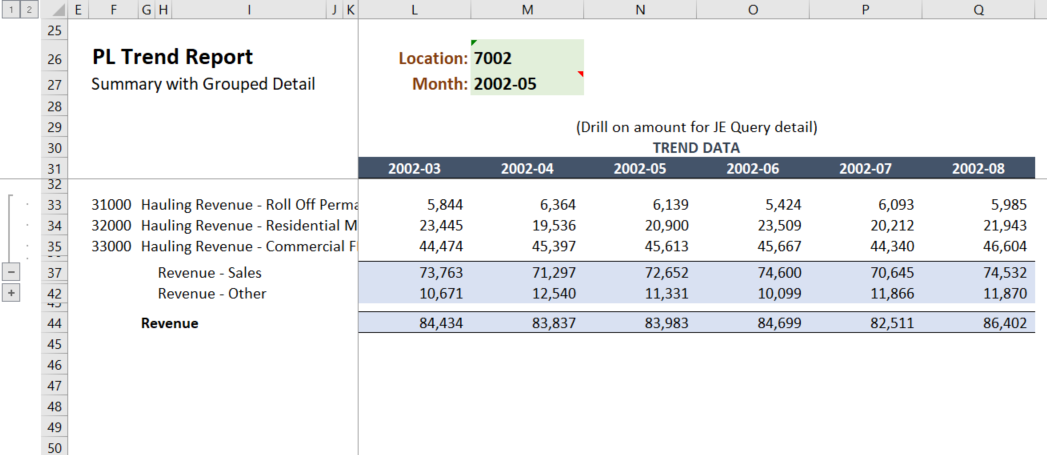
Now use Data Cells to replicate some of the present data. By having both data generated by tabular reports and data cells next to each other, you can confirm that they are yielding the same results.
Step 3: To see how it works, use a Data Cell equation.
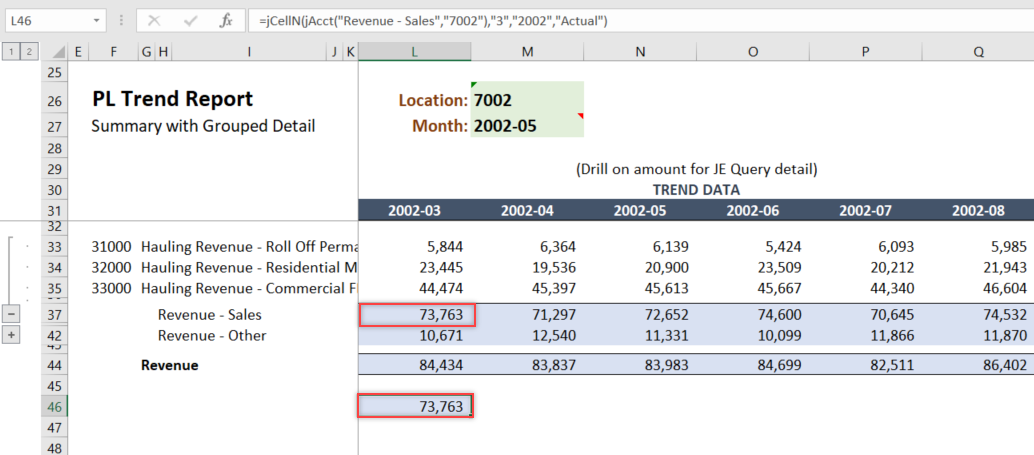
The example below illustrates how the jCell() function can be used to show totals for Actual in March 2002.
To open the function window, select the cell, click on jCellN in the formula bar above the columns, then click the fx button to the left.
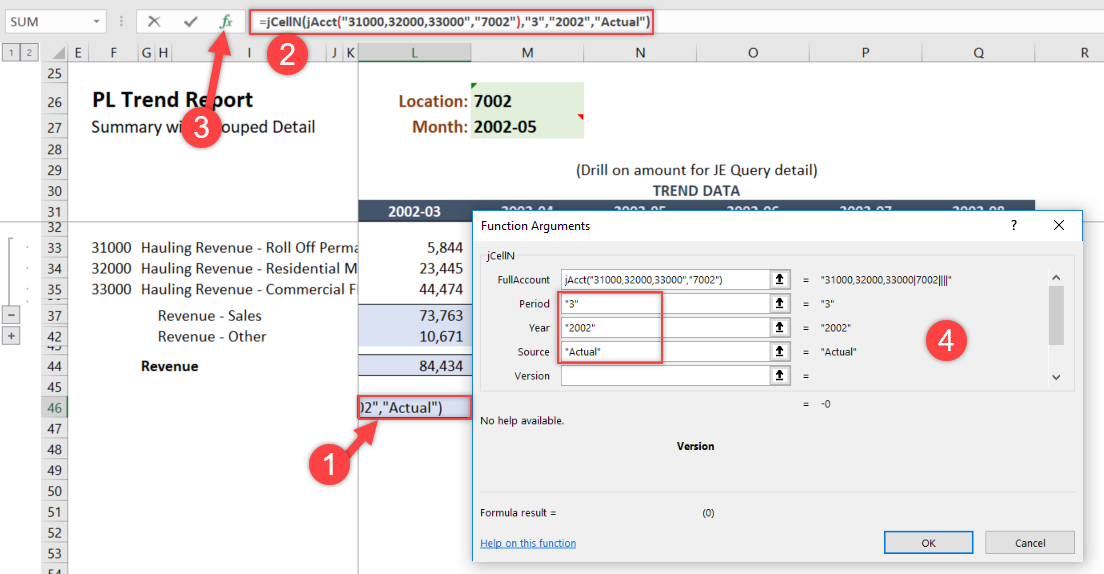
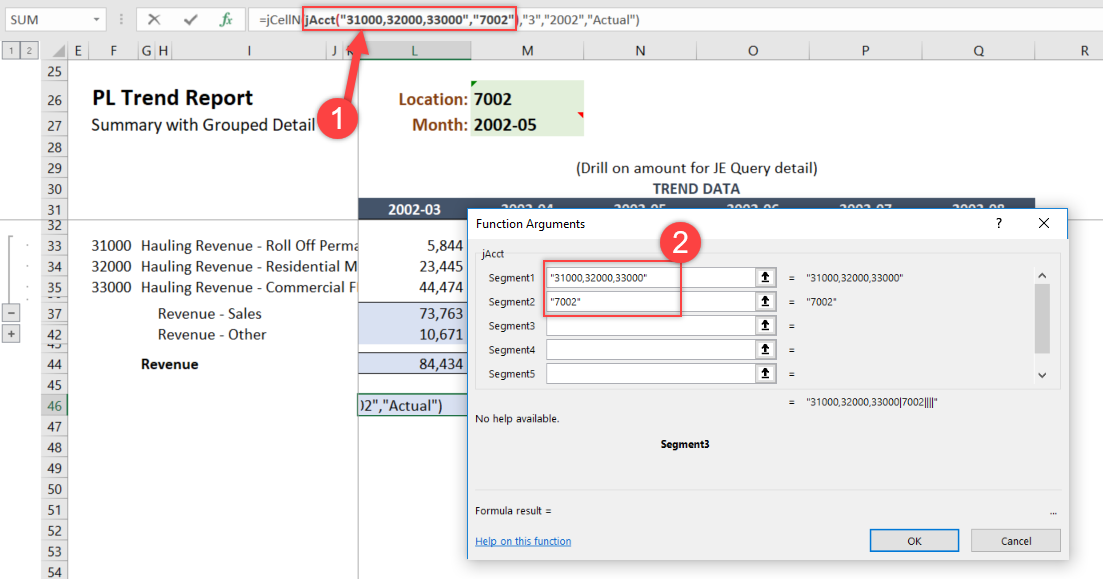
Use the jAcct() function inside the Full Account box to include filters for both the Accounts and Location segments of the chart of accounts.
To get the Function window for jAcct(), just click inside of its function in the formula bar.
In this function you are using accounts 31000, 32000, and 33000 in Segment 1, and the location 7002 in Segment 2.
Notice that these are the same accounts that makeup Revenue - Sales in the original PL Trend and the same location you filtered on earlier.
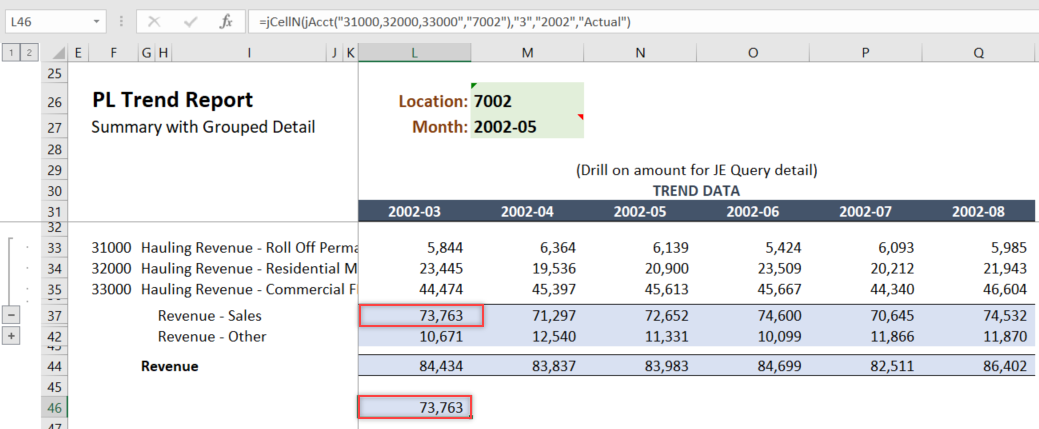
Step 4: Now use the Pull Data function. Ensure that the "Calculate Data Cells" is checked.
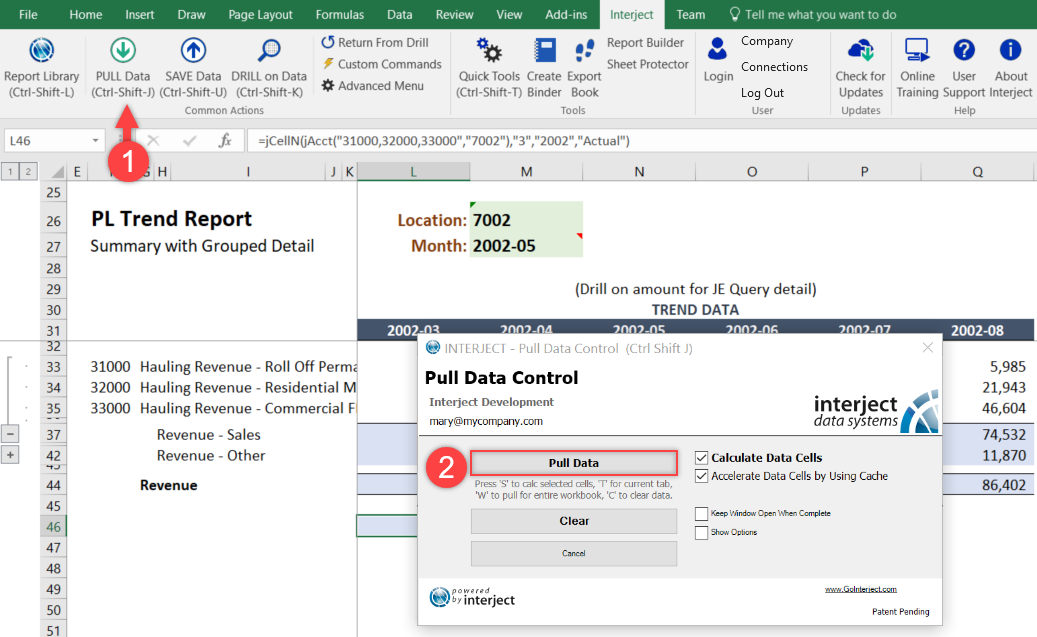
As you can see, the totals for Revenue - Sales match for both the data cell and data list.
Step 5: Listing out each account for a financial group can take time if the account is large enough. Next, try to use data cells again, but this time use groupings to make the function easier.
Go back to the jAcct() function window and change the accounts to be Revenue - Sales instead of the numbered list. Be sure to keep everything else the same.
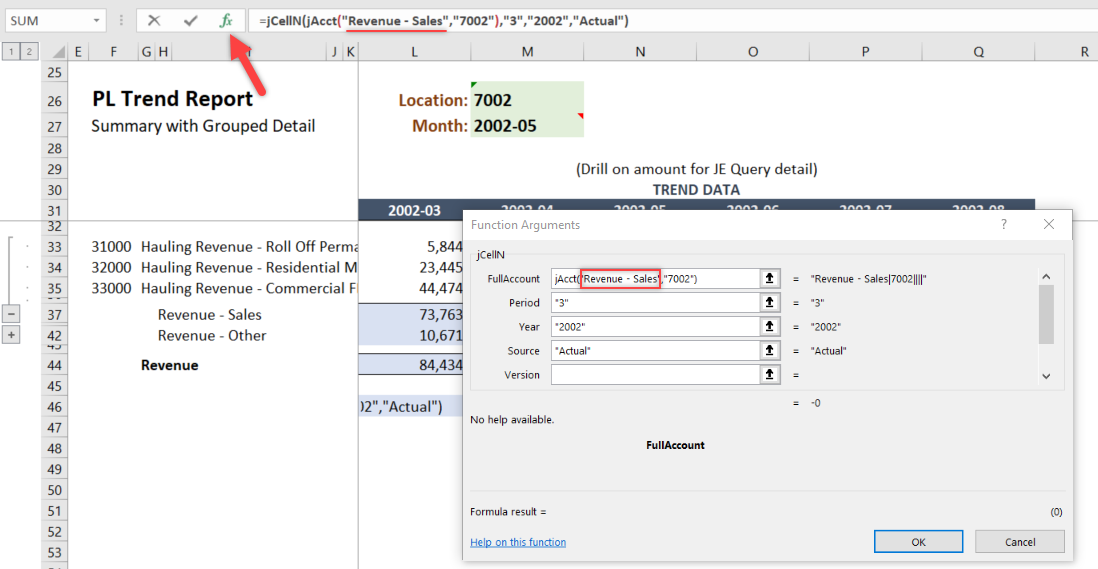
After the switch, you can see that the values still are the same (Note: You may have to re-pull the data). This is because the accounts 31000, 32000, and 33000 are all under the preset grouping Revenue - Sales.
Step 6: More complex filter text can be used to request precise balances. The following example uses a combination of ranges, exclusions, wildcards, and financial groups to return specific data. Even Net Income or EBITDA can be presented in a single worksheet cell.
For more information on the Data Cell Filter options, click here.
In the below example, the groupings to the left of the figures represent the grouping filter in the jAcct Function to the cell beside it. This is so you can see what account groupings are being used for each of the numbers.
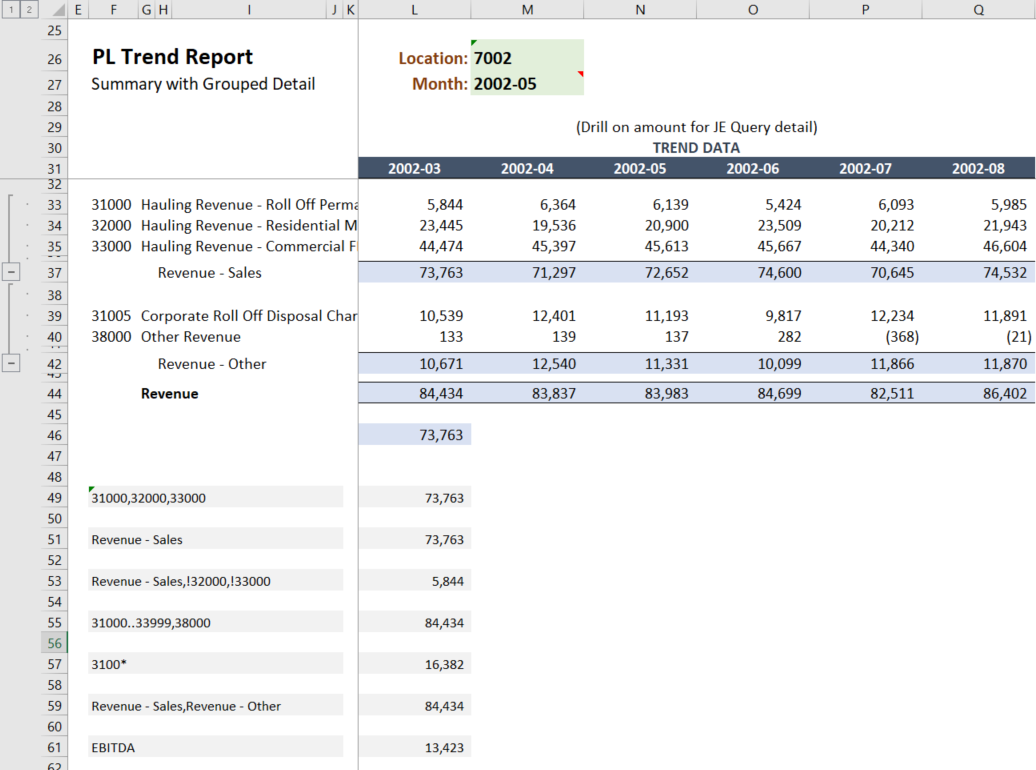
As you can see, the numbers in the data cells tie perfectly with the numbers in the data list above.
A Quick Summary of the Disadvantages of Data Cells vs Tabular Reports
Although using Data Cells (the jCell() function) to construct a report is very flexible and easy to learn, it has drawbacks that create extra work. The ideal applications for Data Cells are special reports that do not have consistent row and column structures and do not present low level details that change.
The main disadvantages of Data Cells are:
- The report will typically run slower, but especially for larger reports. Tabular Reports reports, in comparison, are much faster and more efficient for reporting servers.
- The report will not allow detail lines to be added or removed automatically based on what data exists for the filters. Data Cells create fixed reports that require more maintenance.
- Data Cells are not portable to non-Interject users unless using the export feature to remove the special formulas like jCell().
You find that 90% of a company's needs are handled efficiently by Data List reports as first illustrated in this walkthrough, and in many cases Data Cells are not needed at all. But for certain reporting requirements, Data Cells can be very handy.
This completes the initial walkthrough detailing interactive reporting. Later in this wiki, you will learn how to create reports and drills once Interject has been integrated with ERP software.