Create: Inventory Variable
Estimated reading time: 10 minutesOverview
The ReportVariable() function directs data into multiple specified ranges of a report that can grow and shrink with the data. It is ideal for a financial report or any report that has subtotaled sections. In this example, you will use the report seen in the Inventory Walkthrough. Once completed all rows of the report Inventory By Category with Detail will be populated with a single ReportVariable() function.
If you are following the Training Labs, this report file can be found in the Report Library at Training Labs > Lab 3 Creating Reports > Lab 3.4 Inventory Variable Report.
Report Variable
Step 1: Open the Interject Report Library and select the Interject Inventory Demo in the Interject Demos folder.
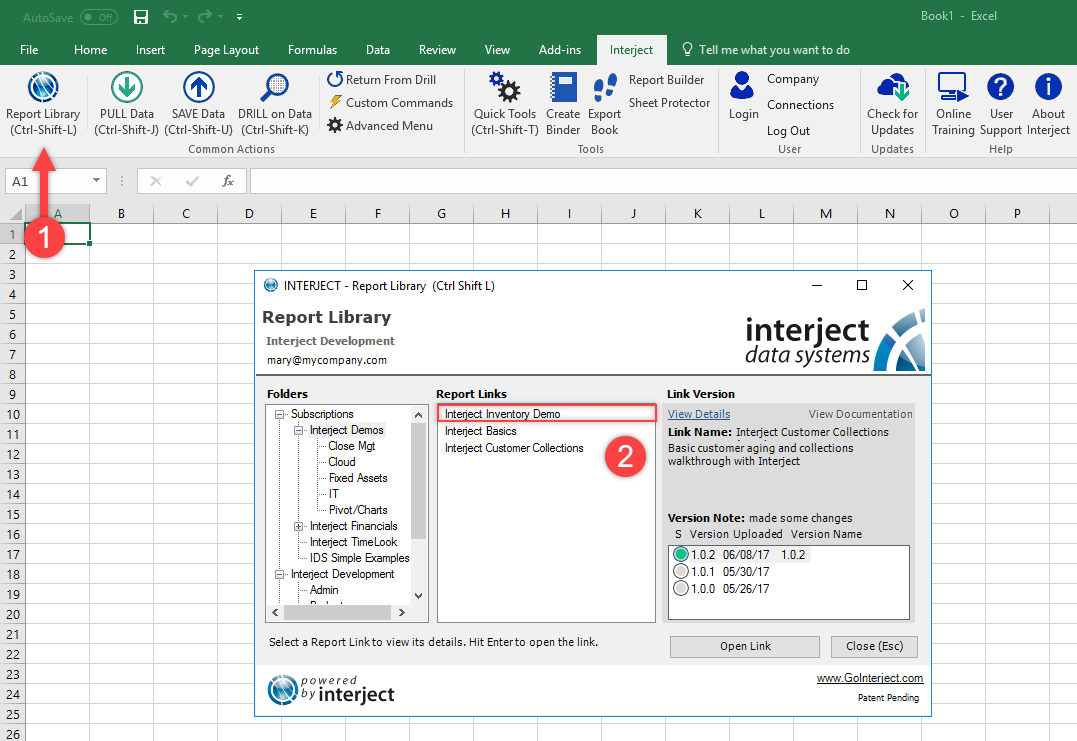
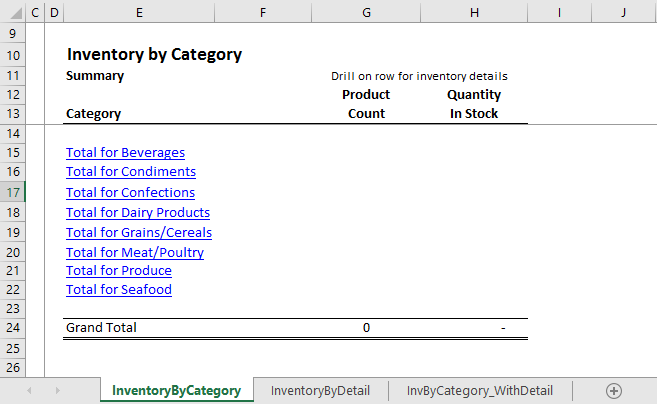
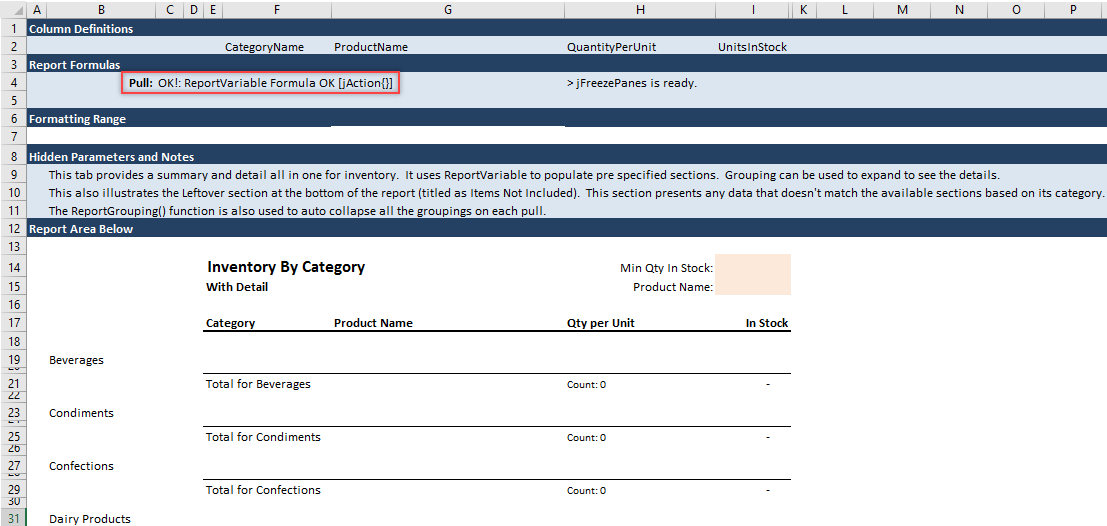
Step 2: The report will open in the InventoryByCategory tab, as shown below.
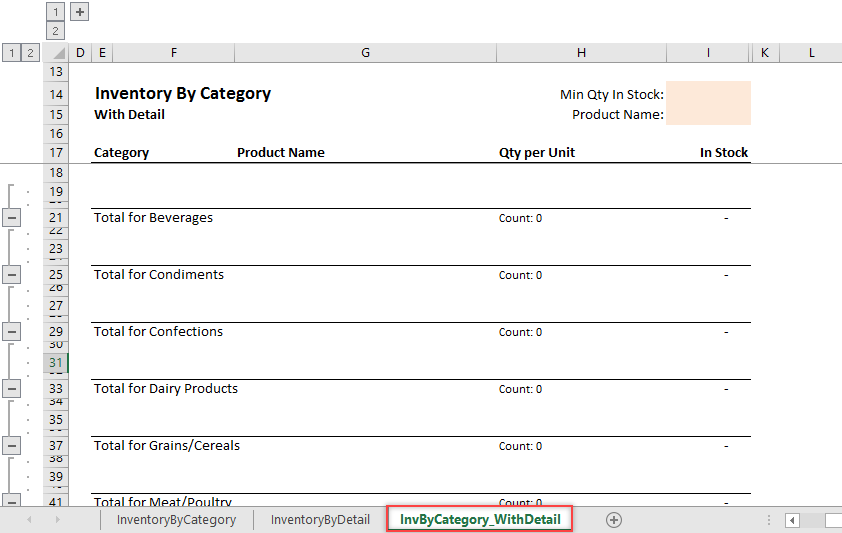
Step 3: For this exercise, you will be using the worksheet InvByCategory_WithDetail. This worksheet is already setup for a Variable section report, and it will help focus on key concepts rather than the spreadsheet text and formatting. Click on the tab InvByCategory_WithDetail.
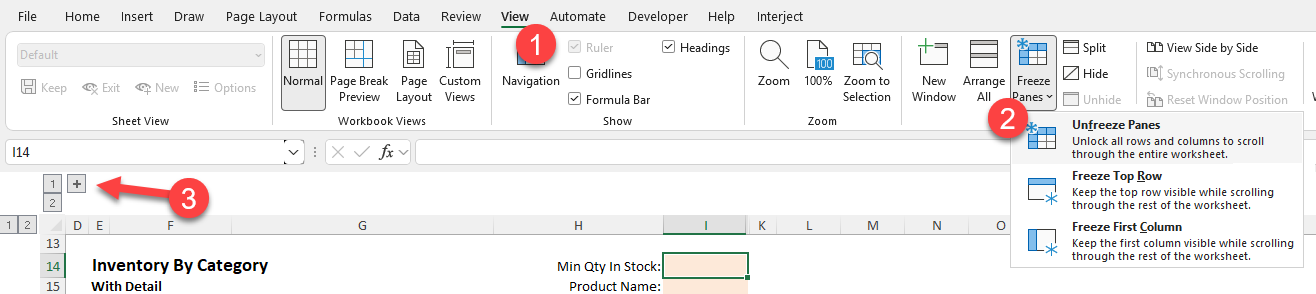
Step 4: Open the configuration section of this report using the following three steps.
- First, select the View ribbon.
- Second, pull down the Freeze Panes menu and select Unfreeze.
- Last, click the plus sign, as shown below, to can expand the column groupings.
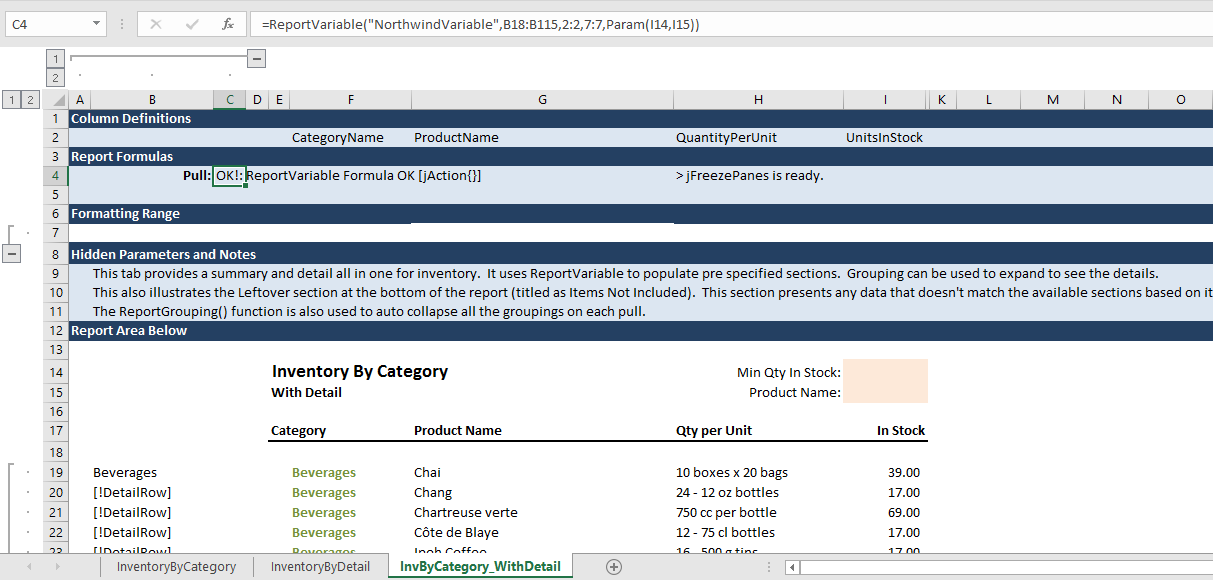
Scroll to the top, and the full configuration area is seen in the left of the report. Clear the formula in cell C4 so you can build the ReportVariable() function from the beginning.
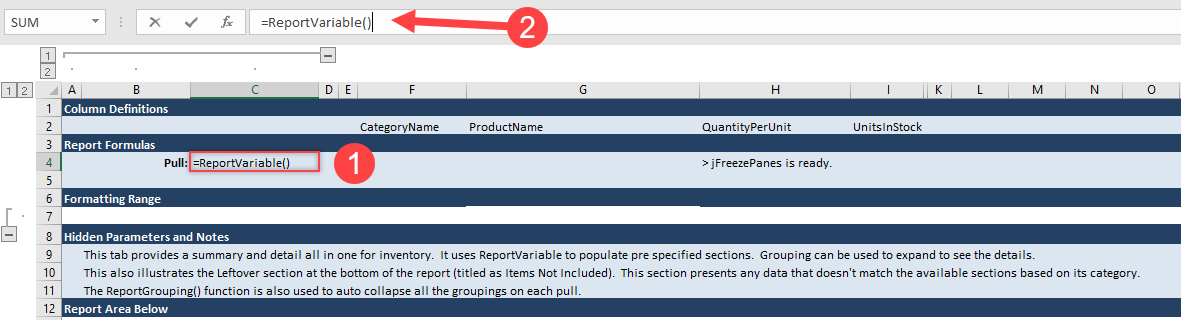
Step 5: Now create a new report formula. In cell C4 type =ReportVariable().
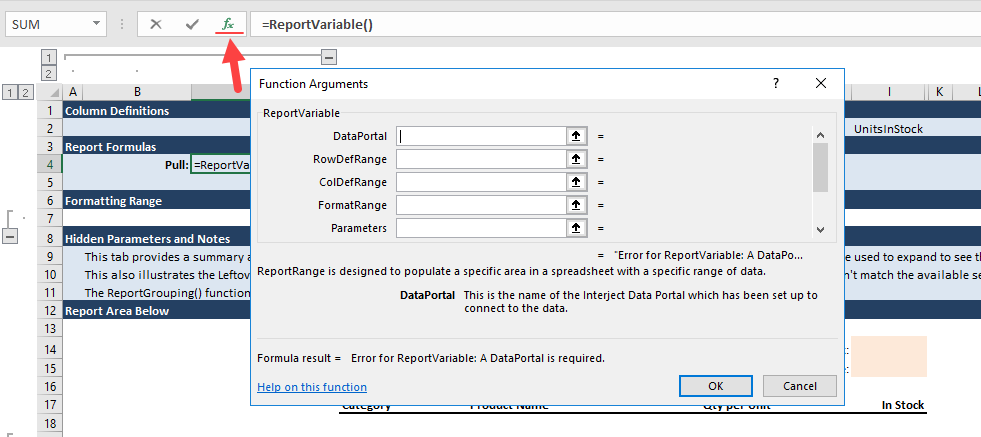
Step 6: Next, click the fx button left of the formula to open the Function Wizard.
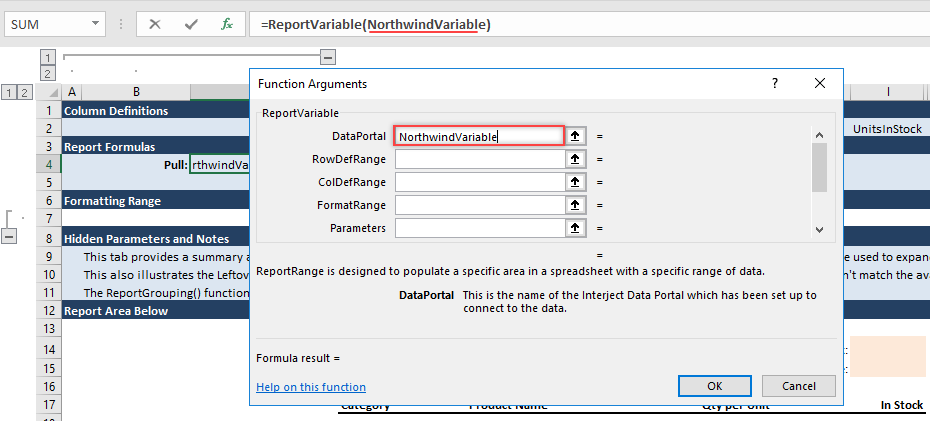
Step 7: First enter the Data Portal for this example. Type NorthwindVariable in the Data Portal argument.
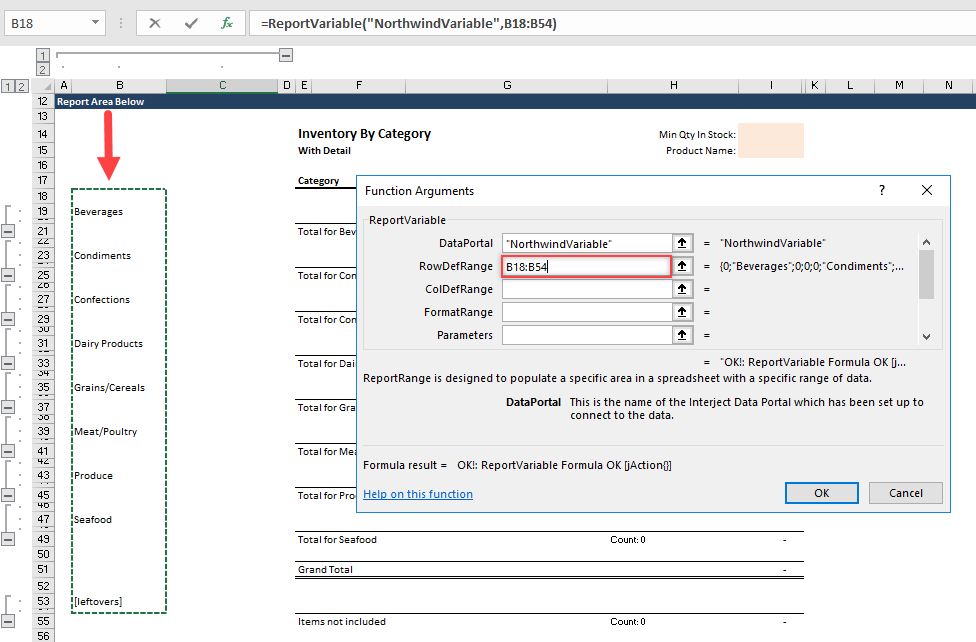
Step 8: Next, setup the Column and Row Definitions for this report.
For the RowDefRange argument, type B18:B54. This covers the Row Definitions for the main body of the report. Notice each group is separated by at least one row. This is required for the categories to be populated separately. This section also includes the Leftover section as well. This leftover section is special, since it will show any records that did not populate in one of the sections above. This helps ensure you are not missing any data in the report.
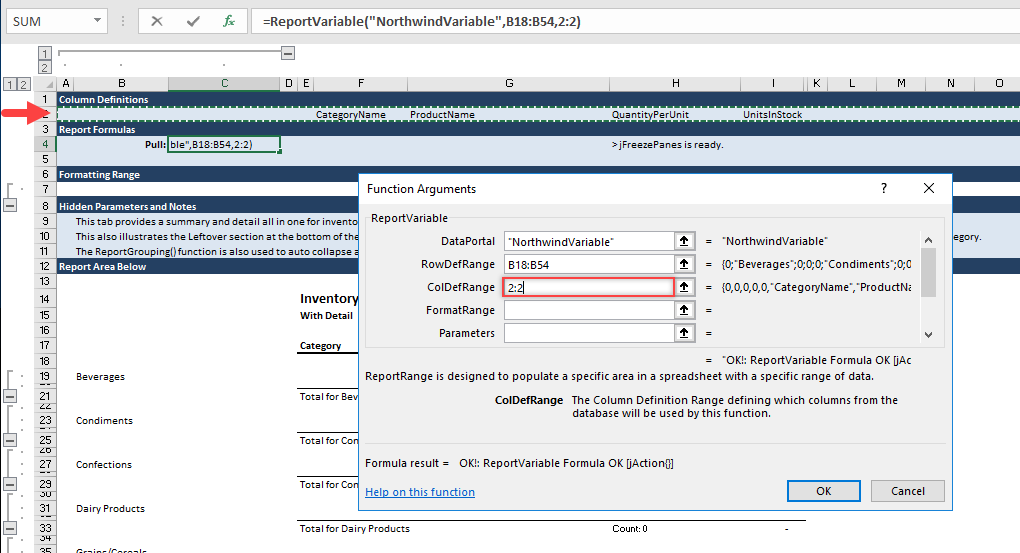
For the ColDefRange argument, simply input 2:2, since the Column Definitions are already setup in row 2 for this report.
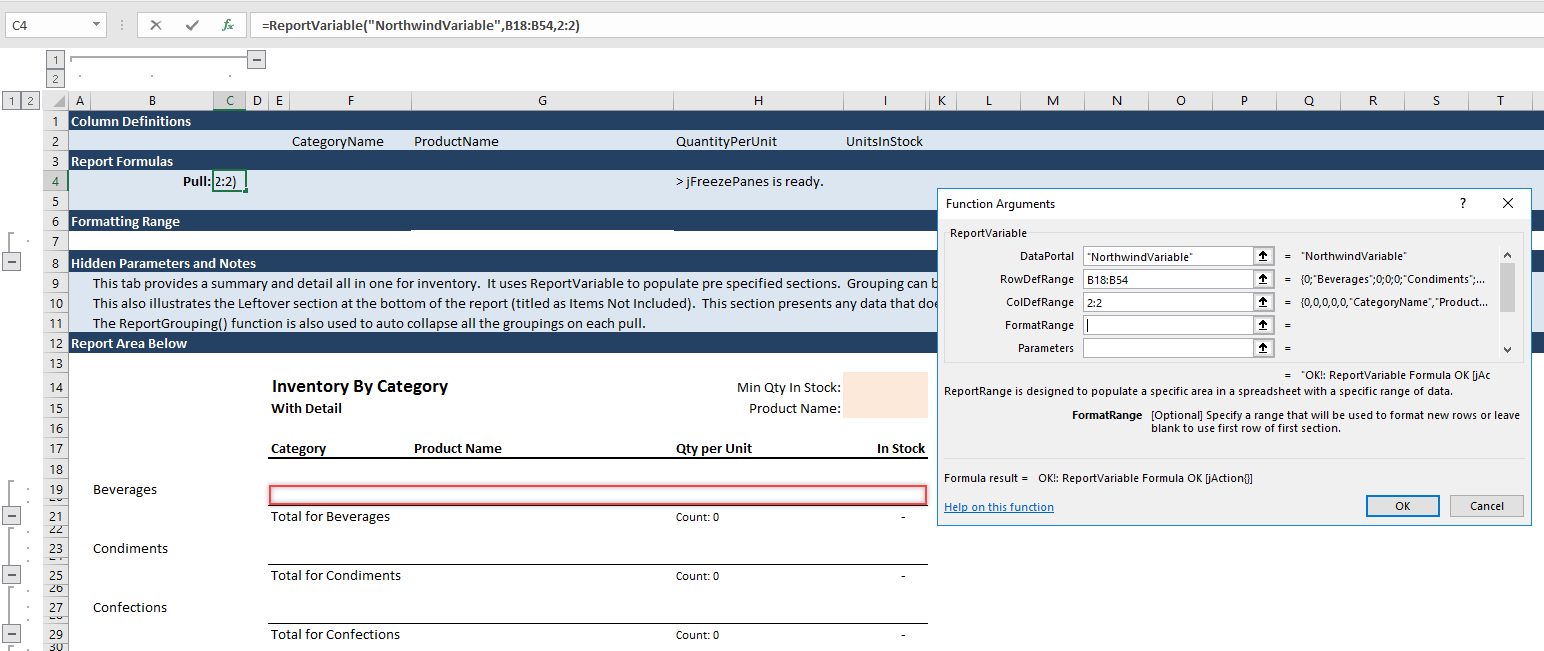
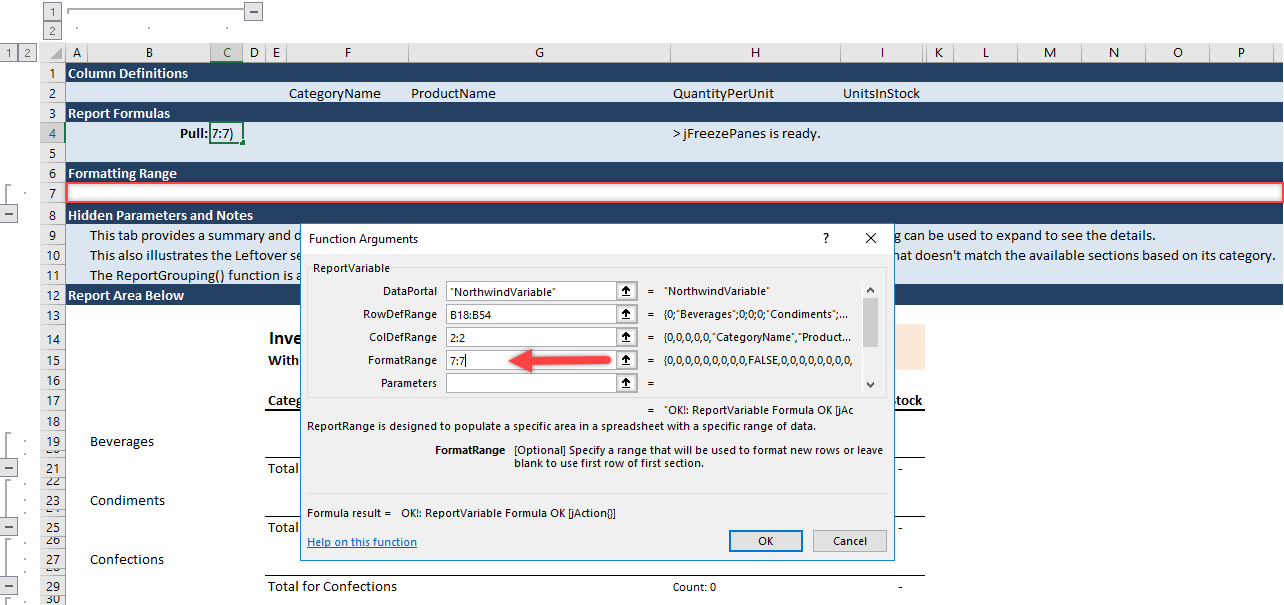
Step 9: The detail rows of a Variable report are typically formatted using the Formatting Range. Initially, use the first row of the first section to set the formatting. Leave the FormatRange argument blank.
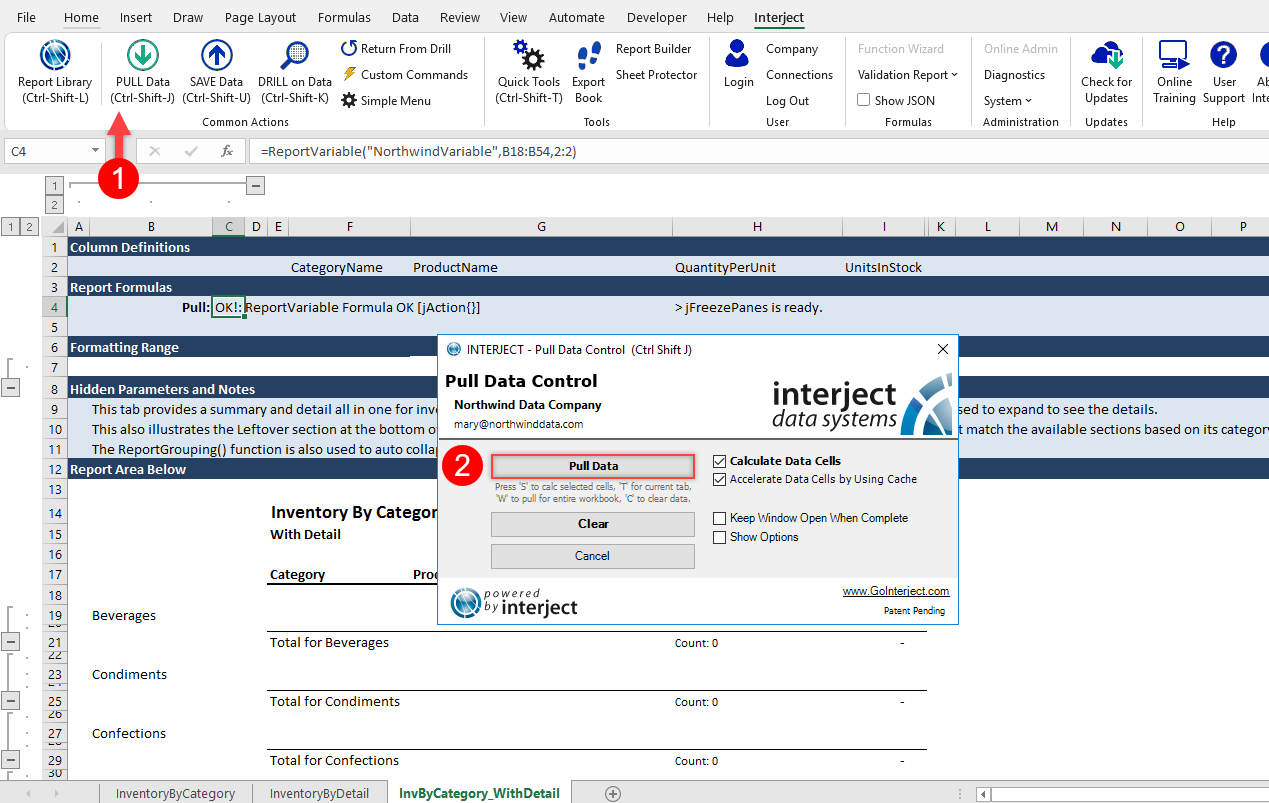
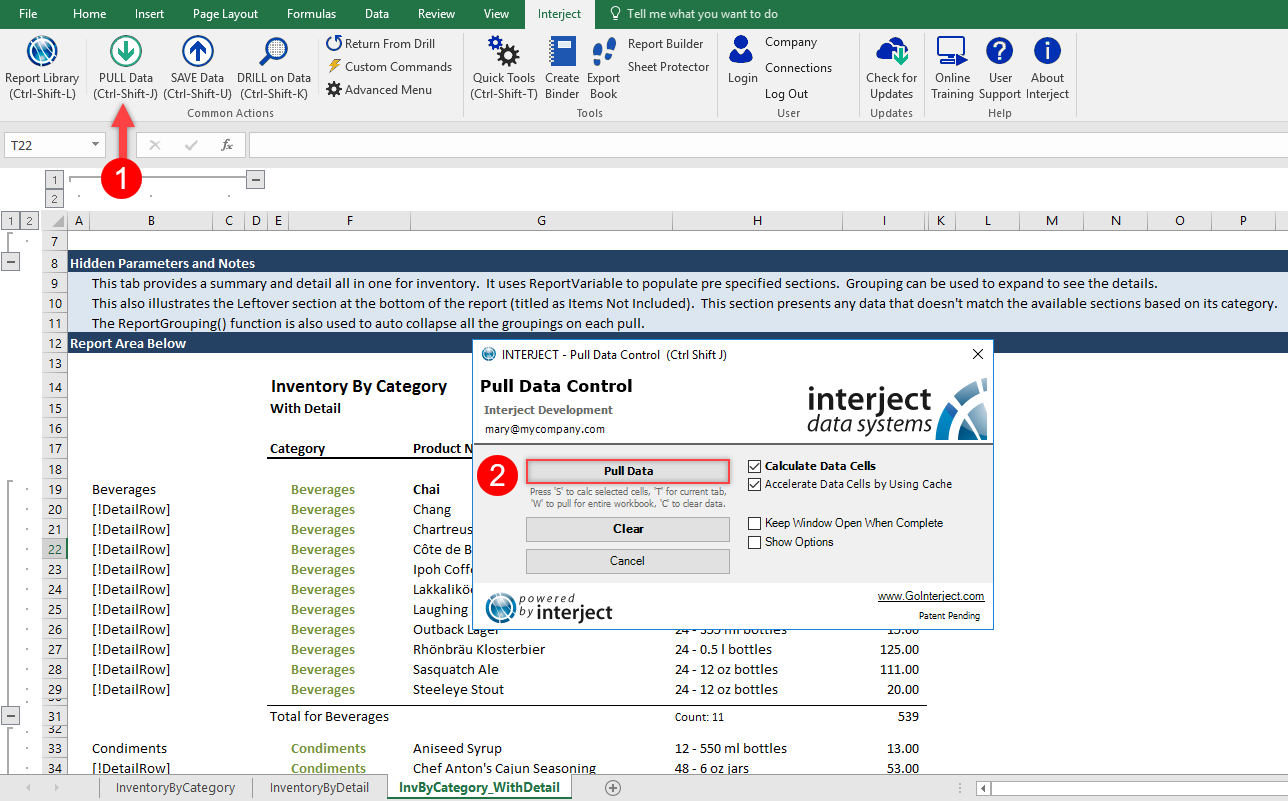
Pull the report.
With the report pulled, see how data was inserted into each of its sections, and each section expanded to fit the data. You can even see how the Leftover section works. Try changing the cell B19 from Beverages to BeveragesSkip. When you pull again, that section's records will move to the bottom. Go ahead and change B19 back to Beverages and re-pull. The data will return to the correct section.
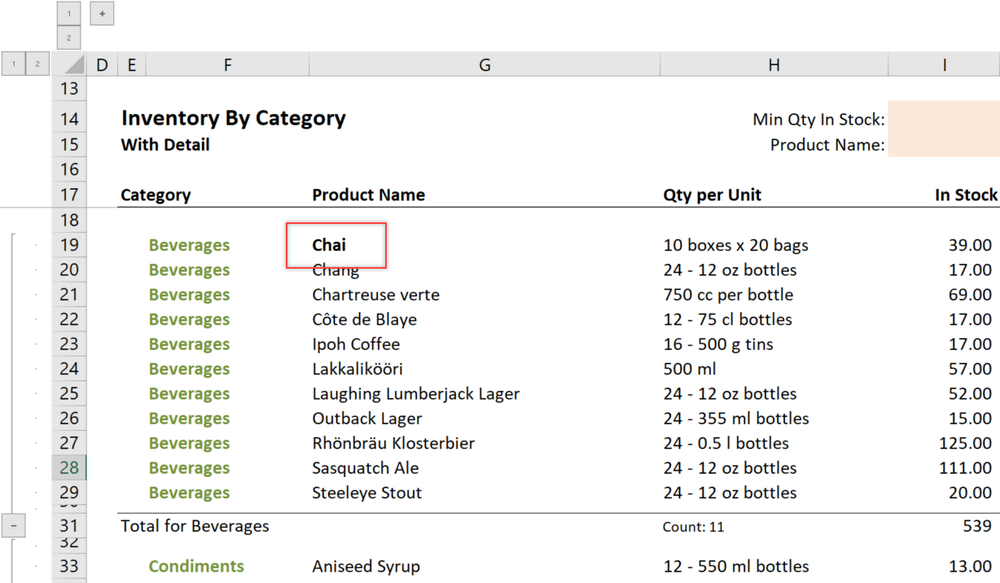
Step 10: Once you have pulled the report, adjust the formatting. You can select the top row (row 19) and change the format in one of the columns. Make Product Name bold, as it is below.
Pull again.
You can see that all the rows below Chai in the Product Name column are bold like the first row. If you scroll further down the report, the other sections will have the bold format as well.
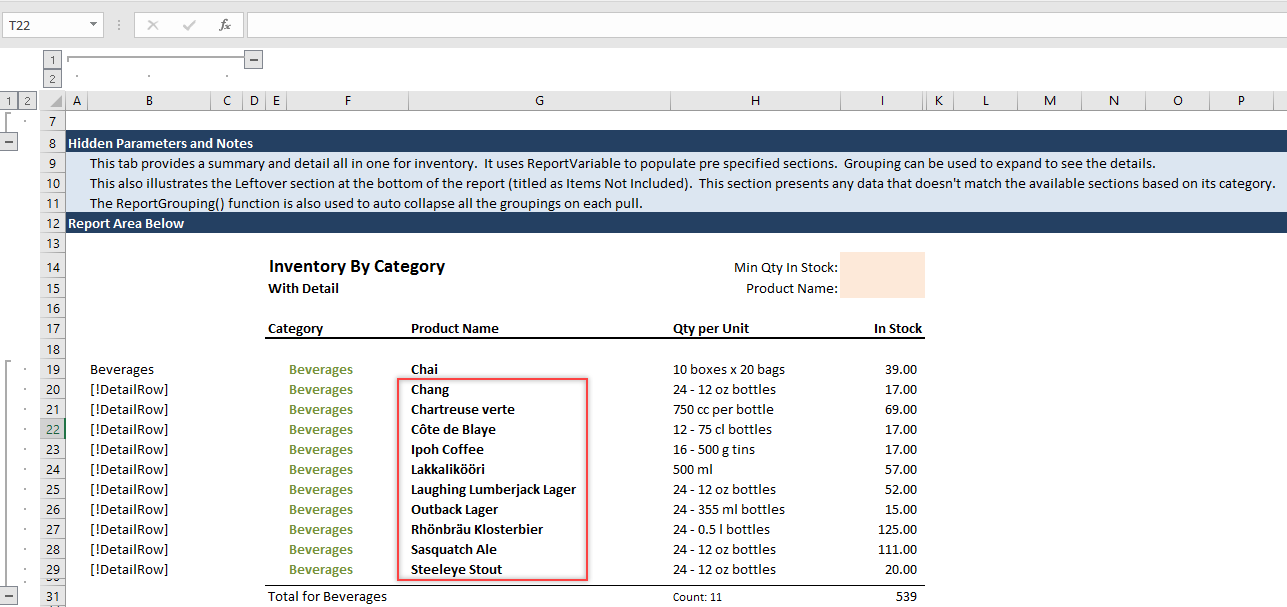
Step 11: The most common approach is using a formatting range. The existing report has a Formatting Range prepared in row 7. Update the ReportVariable() function in C4 to have a Formatting Range of 7:7. From this point forward, when the data is pulled, the formatting, values, and formulas placed in the Formatting Range will be used in all the sections below.
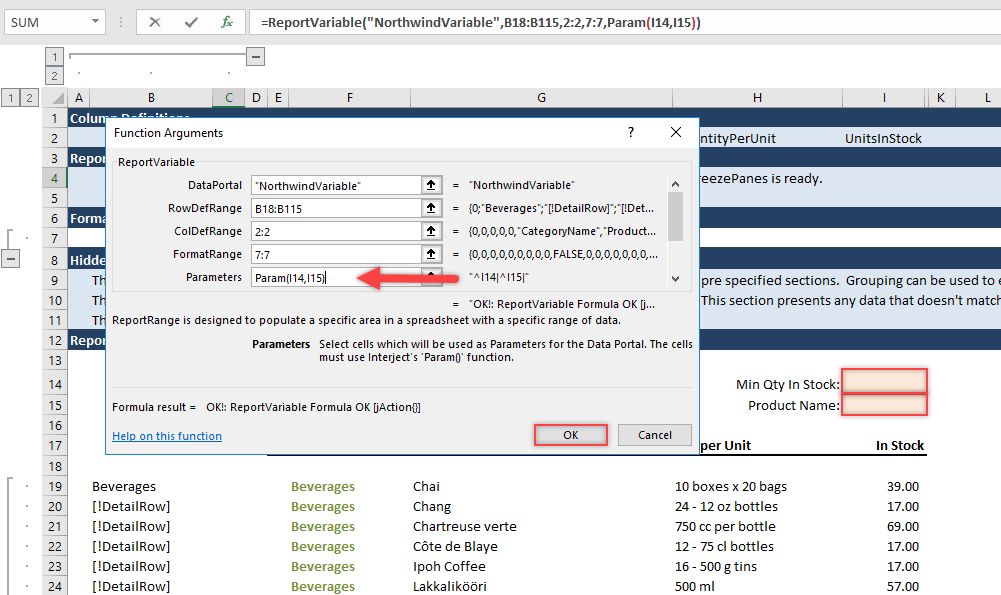
Step 12: Now, add the filters. In this Data Portal and report there are two filter options, Min Qty In Stock and Product Name. Open the Function Wizard again on cell C4 and enter Param( I14, I15 ) into the Parameter argument. This configures Interject to look for the filters in cells I14 and I15. The order of cell references appearing in the Param() function must coincide with the order that was originally setup for the Data Portal.
Final Touches
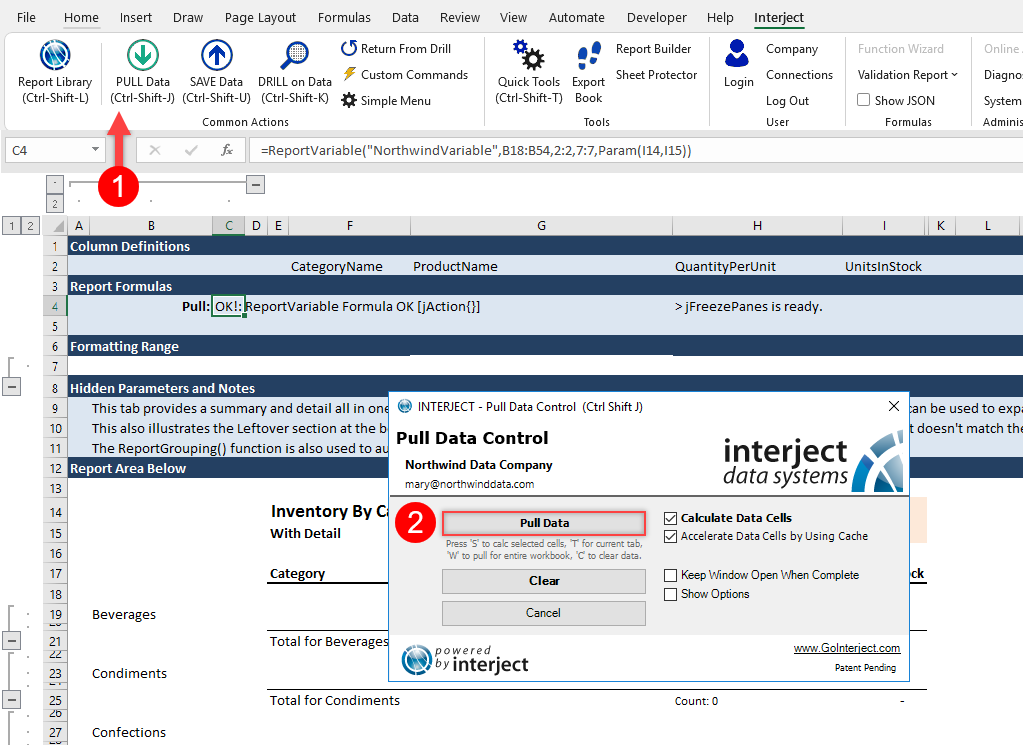
Once you have finished all steps above, check the report by re-pulling.
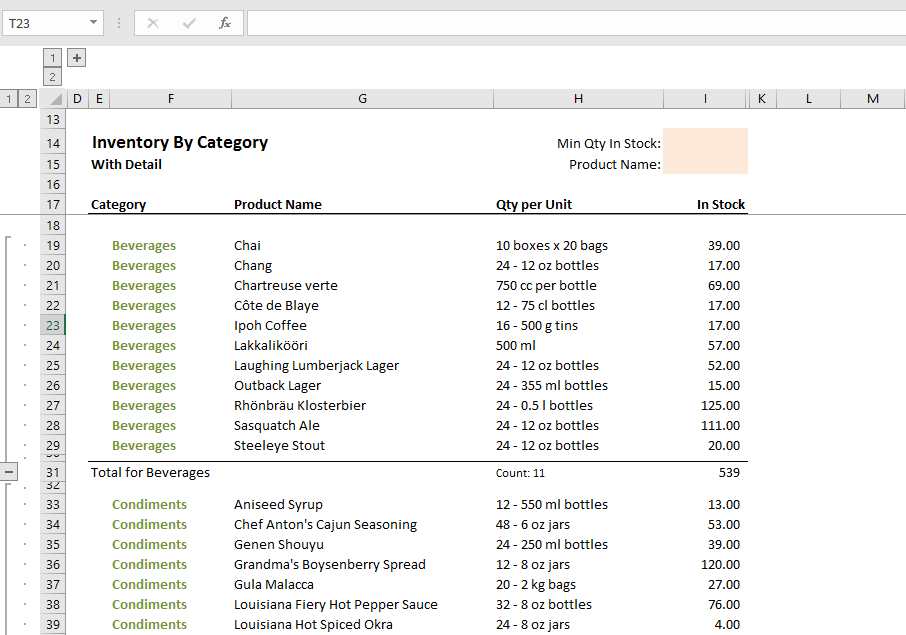
The data should be presented as shown below.
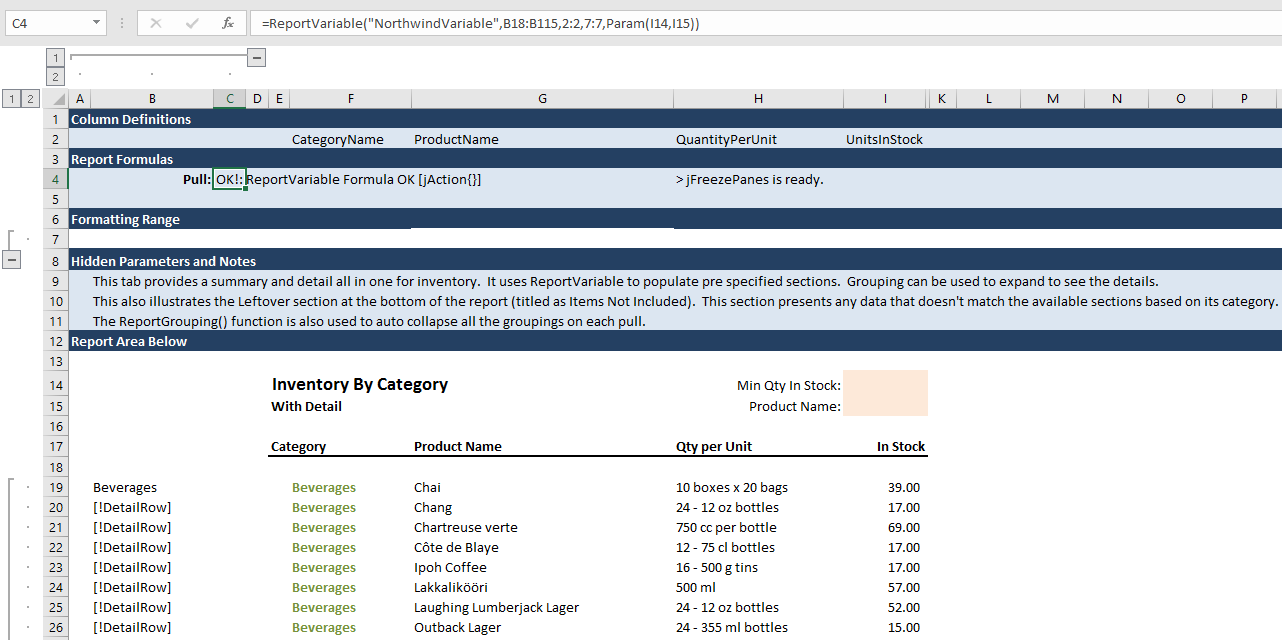
Once the panes are frozen using Interject's Freeze Panes, the final result should look similar to the image below.
ReportGrouping()
Step 1: The ReportGrouping() function will collapse or expand all the groups after an Interject event. In this case, we will set up ReportGrouping to collapse the groups after a pulling the data (Pull-Run event).
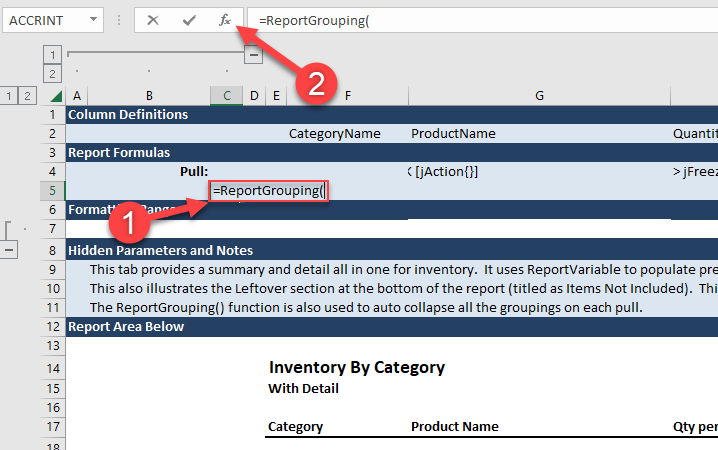
Click cell C5 and enter =ReportGrouping() and then click the Function Wizard button.
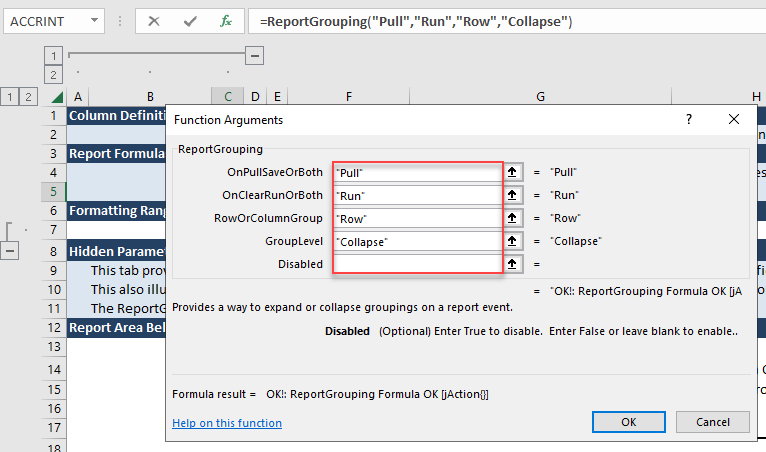
Step 2: Enter "Pull" for OnPullSaveOrBoth, "Run" for OnClearRunOrBoth, "Row" for RowOrColumnGroup, and "Collapse" for GroupLevel. This will collapse all row groups on a Pull-Run event.
Step 3: Pull the data.
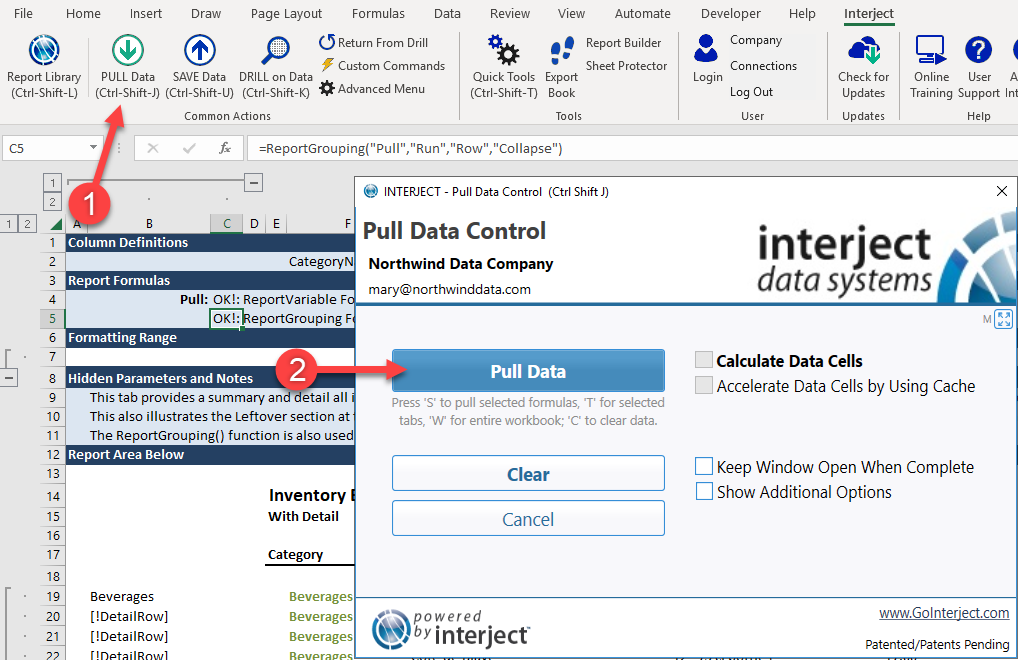
Notice all the groups are collapsed.
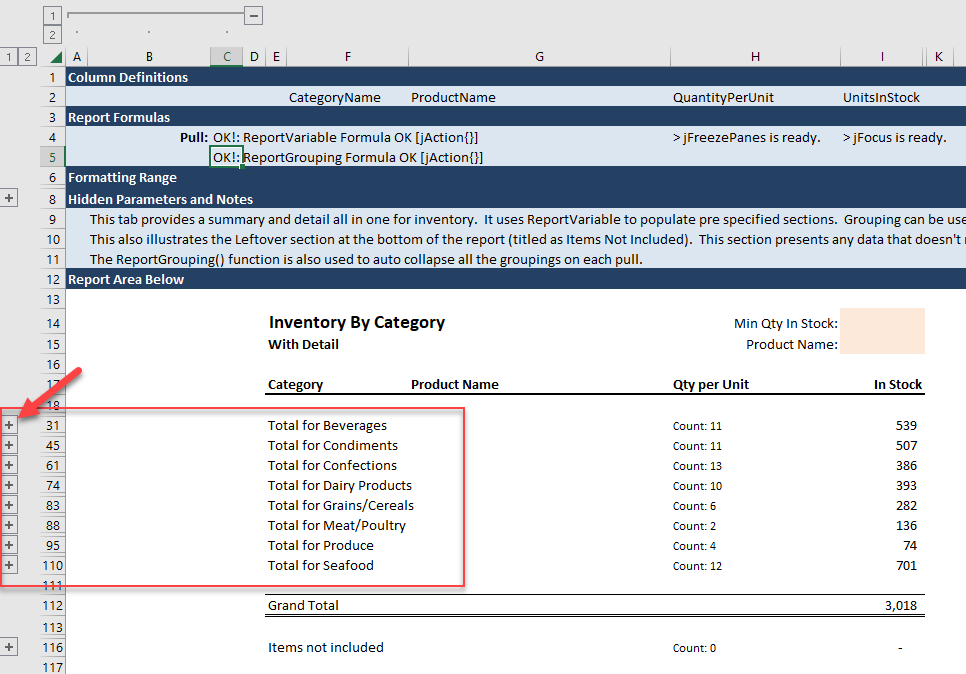
Finally, clear the report and save the file to the Report Library "My Favorites" folder. (For detailed instructions on how to save a file to the Report Library, see here.)