Create: Customer Orders Report
Estimated reading time: 13 minutesOverview
This page illustrates the process of building a Customer Order report from scratch and uses the multi-row option to provide a more advanced presentation. Here you will get a better understating of the ReportRange() and the jFreezePanes() functions.
If you are following the Training Labs, this is Lab 3.2. Note: The Report Library at Training Labs for this lab will be blank as you are creating a report from a new blank Excel sheet.
Building the Report
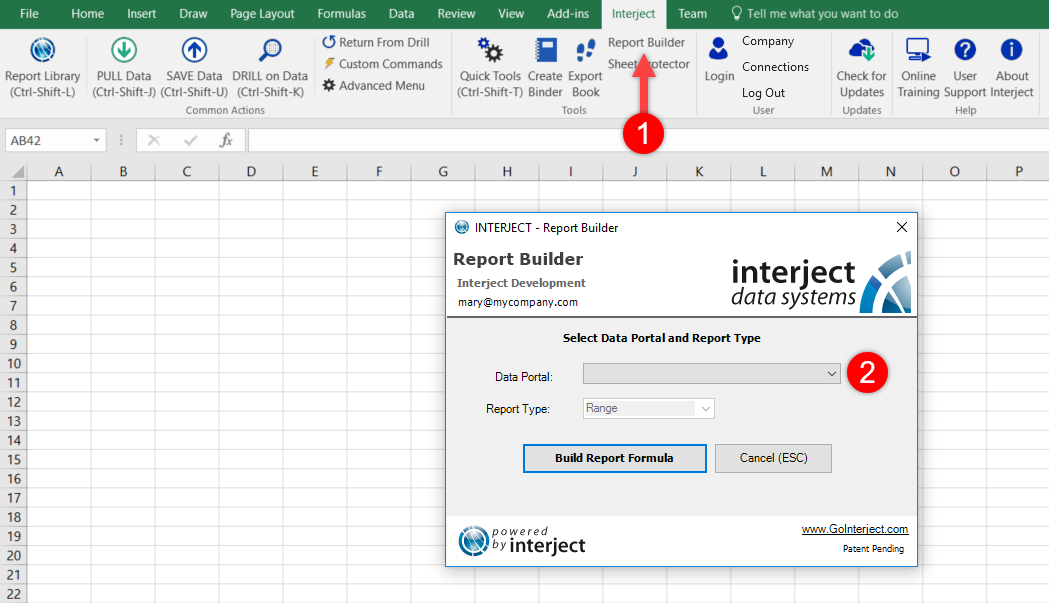
Step 1: This process begins with the Interject Report Builder. Open the Report Build as illustrated below. There is a drop down list of Data Portals that can be chosen. An Interject Data Portal is a pre-configured data query that is setup so spreadsheet users can easily direct data into their own spreadsheet reports. Data Portals can be setup to access databases or cloud data and are either setup by Interject developers or an IT team.
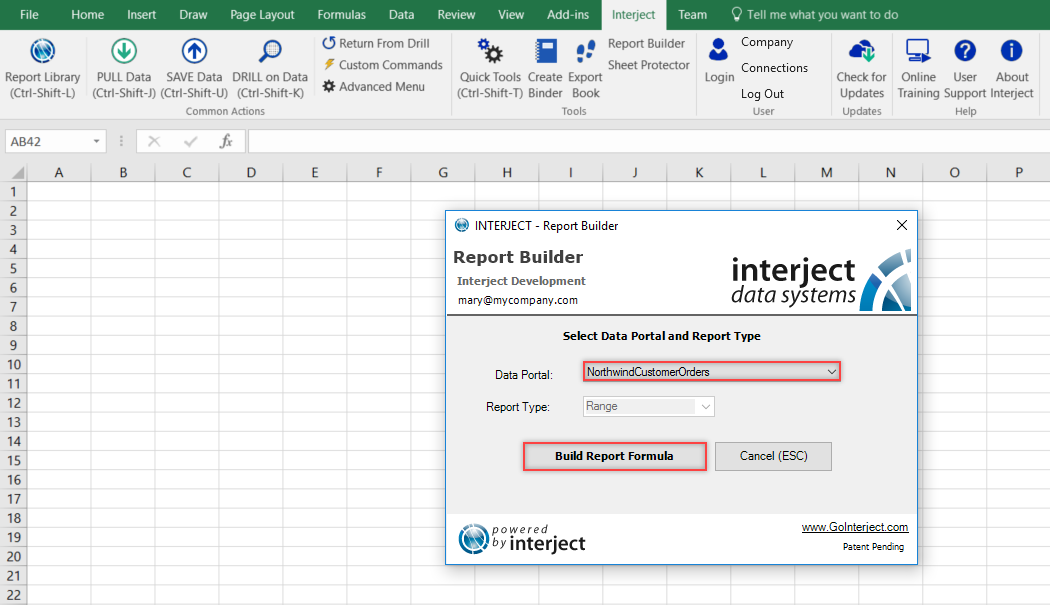
Step 2: For this Customer Orders report, use the NorthwindCustomerOrders Data Portal. Once chosen, click the Build Report Formula button.
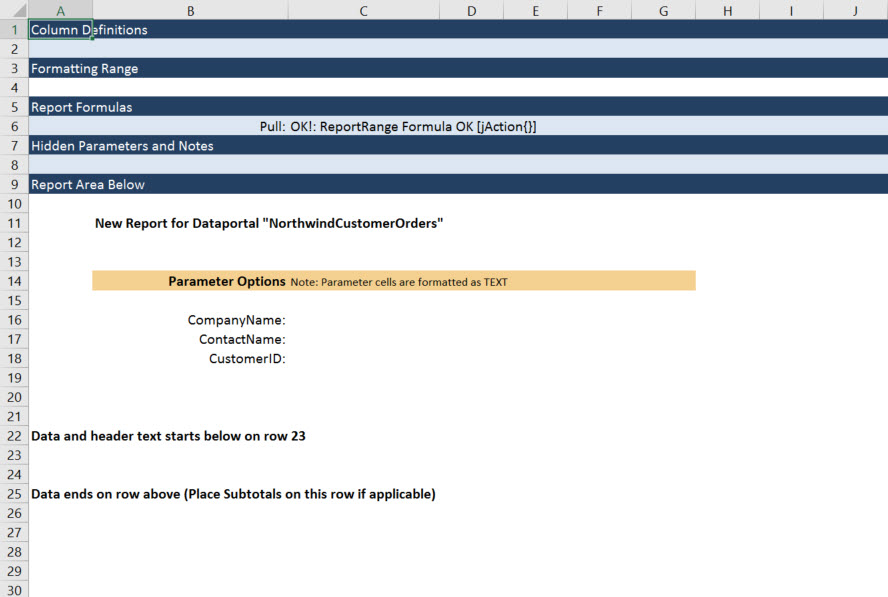
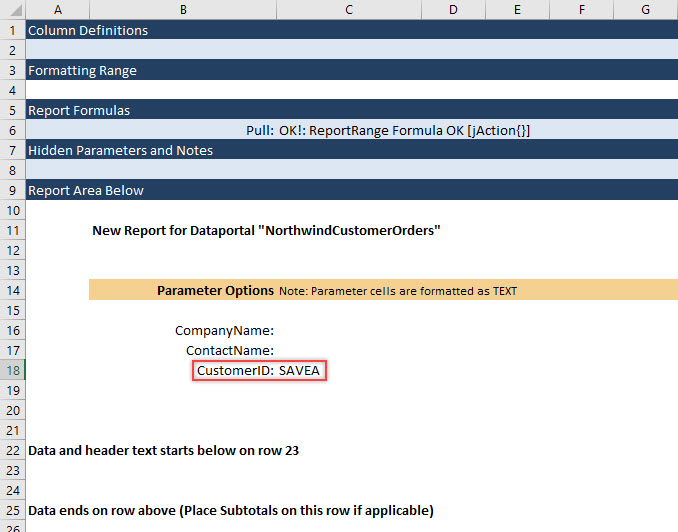
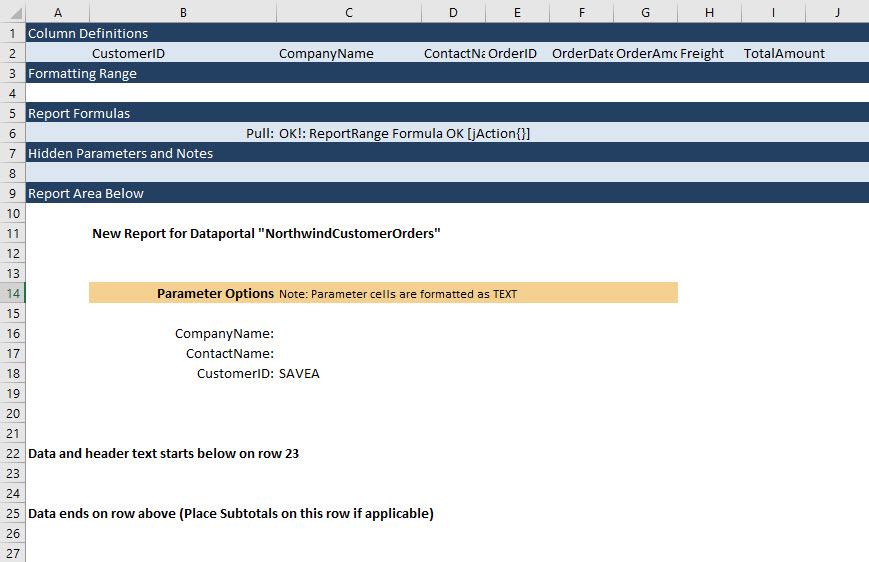
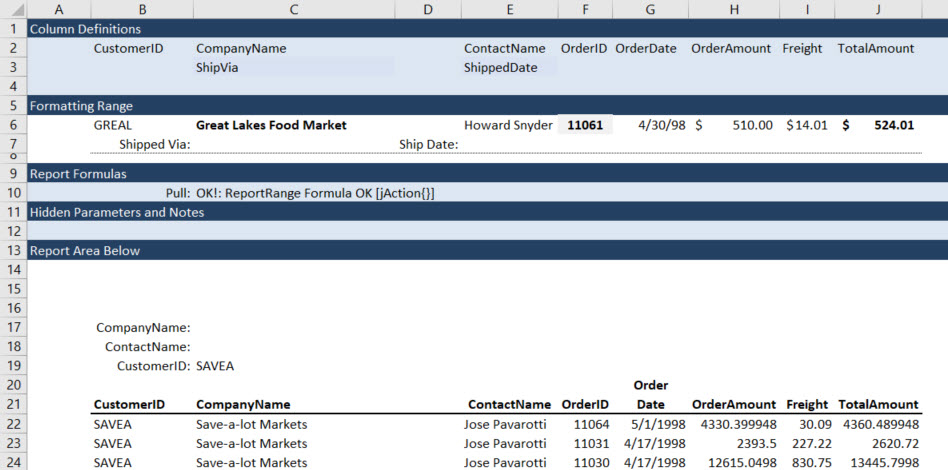
A new sheet should be added that looks like the screenshot below. Now the report is ready for further customization.
Customizing the Report
Step 1: Before you pull in the data, type SAVEA in the CustomerID field to shorten the data-set and make it easier to work with.
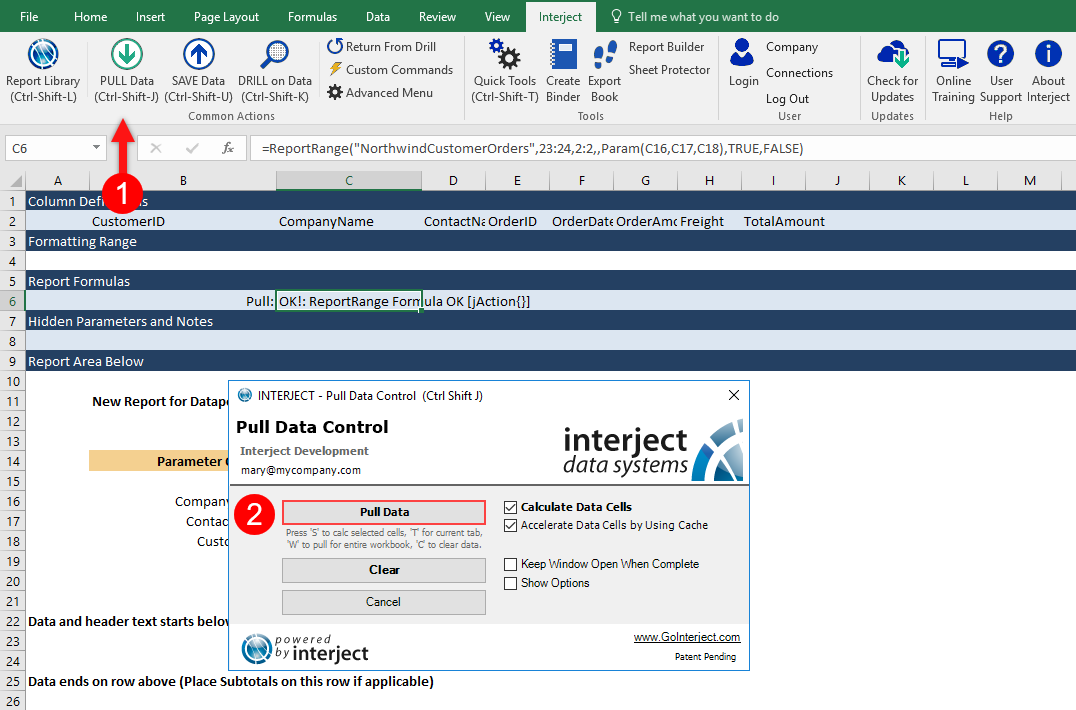
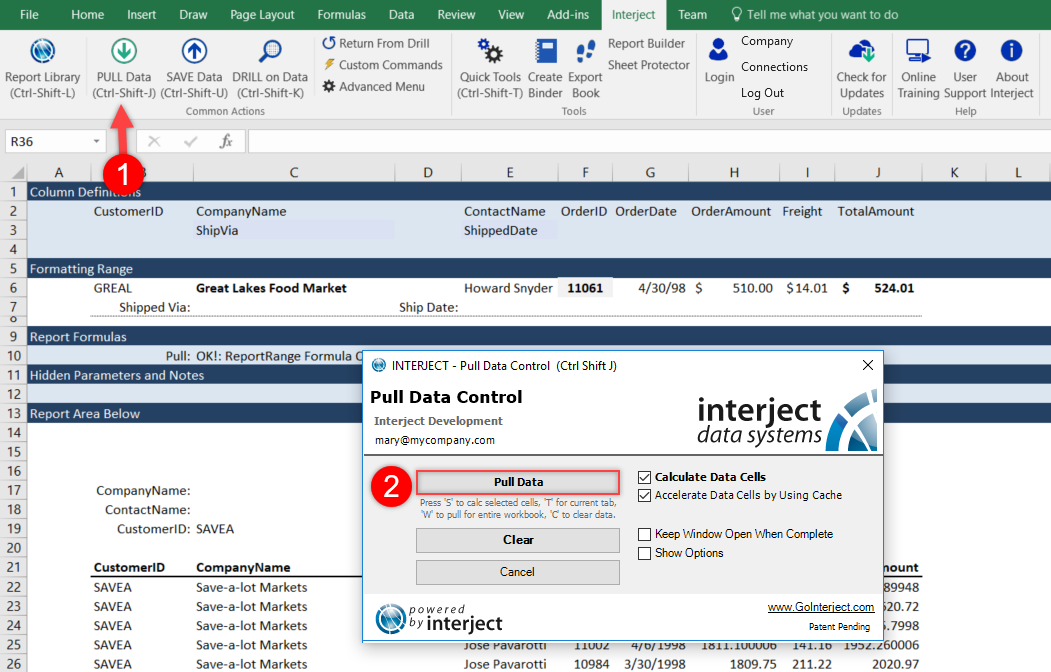
Step 2: Now use the Pull on Data menu item to grab the data.
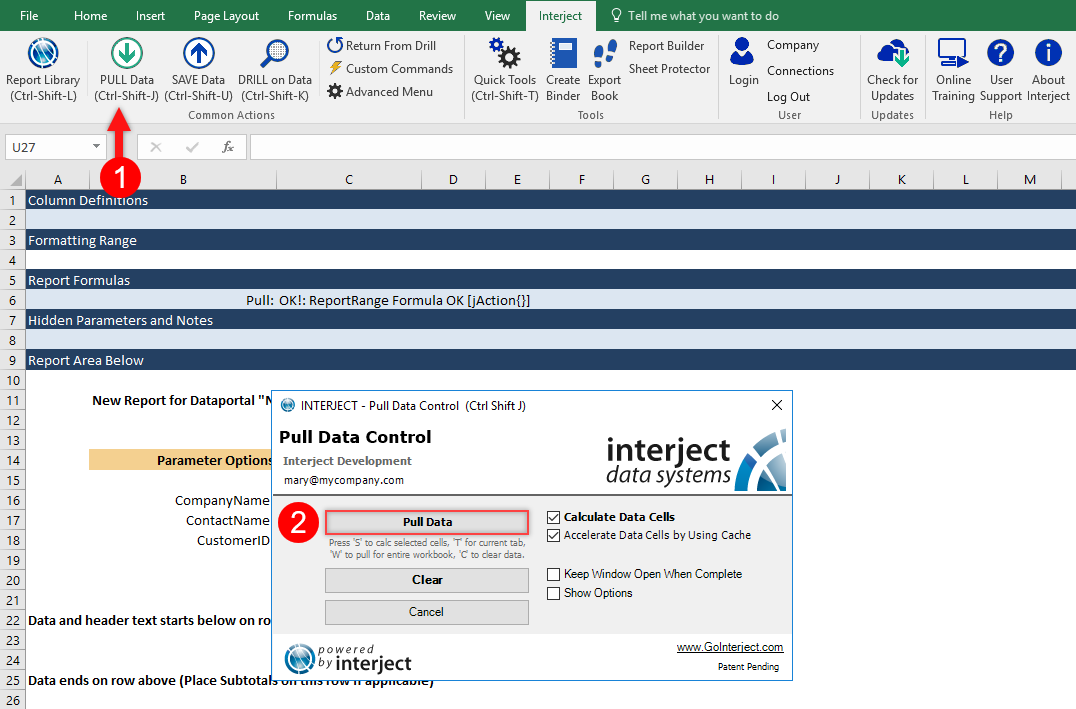
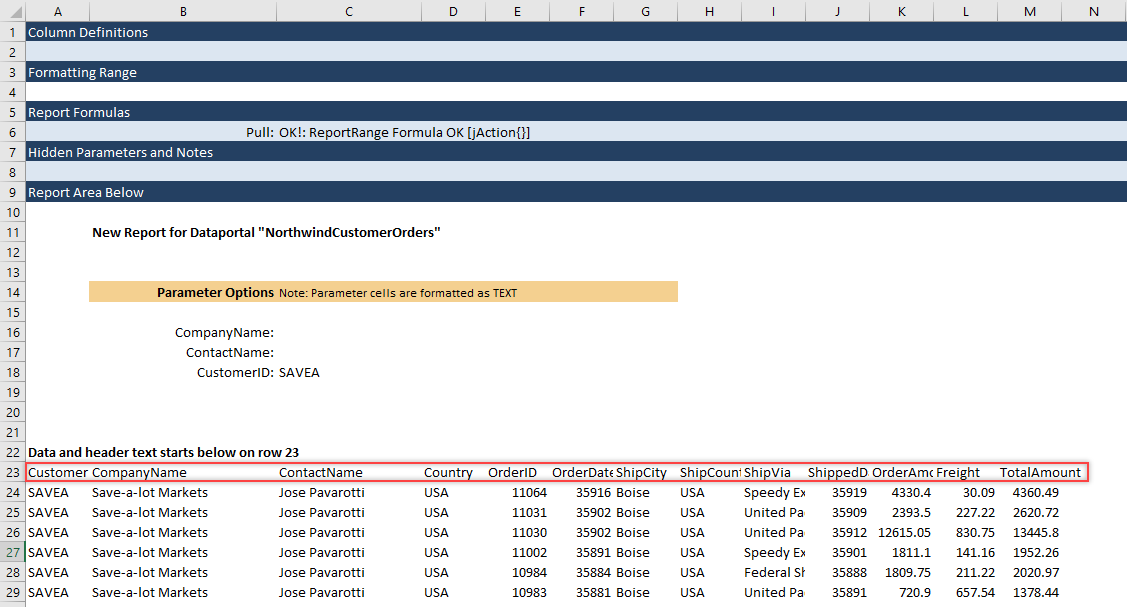
You can now see all the columns available in the Data Portal will be shown by default with the column names on the first row.
Step 3: Select a few columns for our report by copying a few of the column names to the Column Definition area on row 2. Follow the animated GIF below to multi-select CustomerID, CompanyName, ContactName, OrderID, OrderDate, OrderAmount, Freight, and TotalAmount. You can select them all individually while holding the Ctrl key. Then you can copy and paste them all at once in cell B2.
Step 4: Once the Column Definitions are set, clear the report using the Pull Data menu item and choose the Clear Data button.
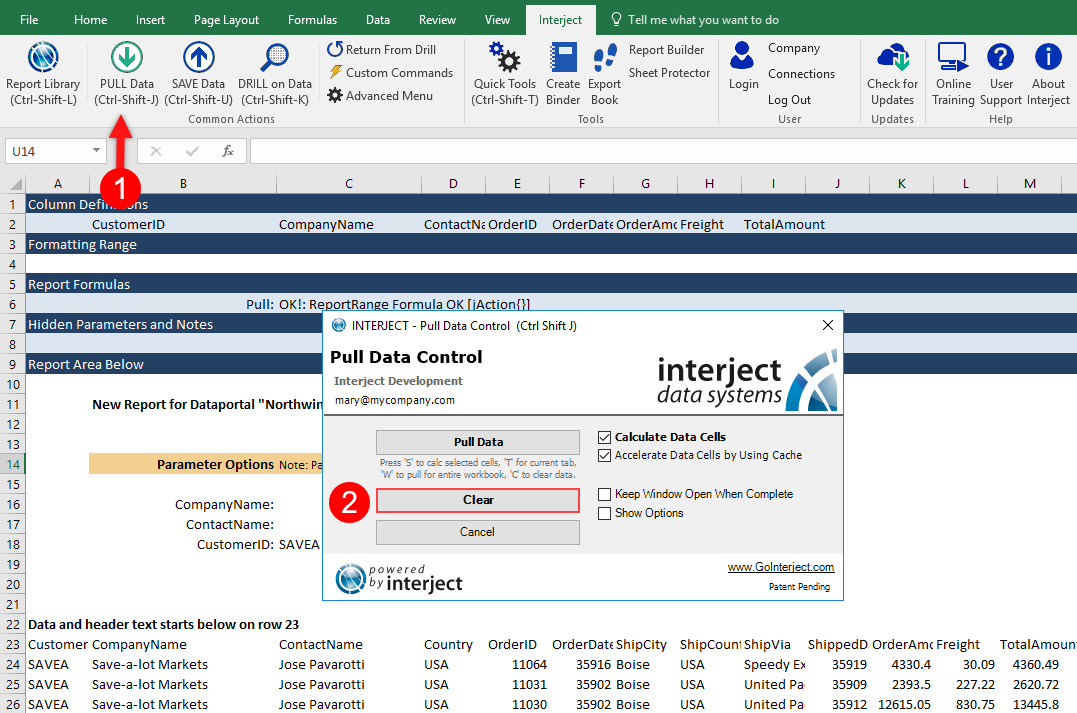
The cleared report should look like this.
Editing the Report Function
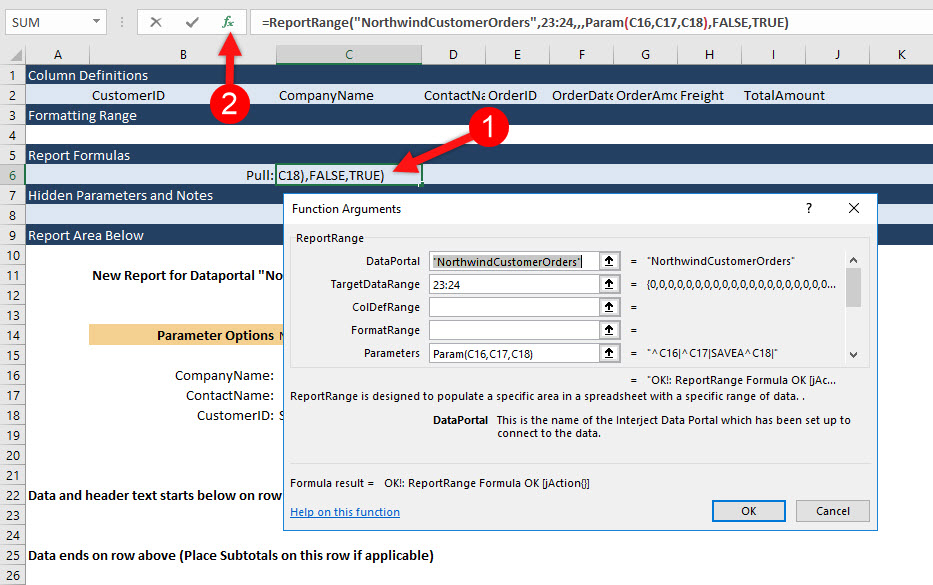
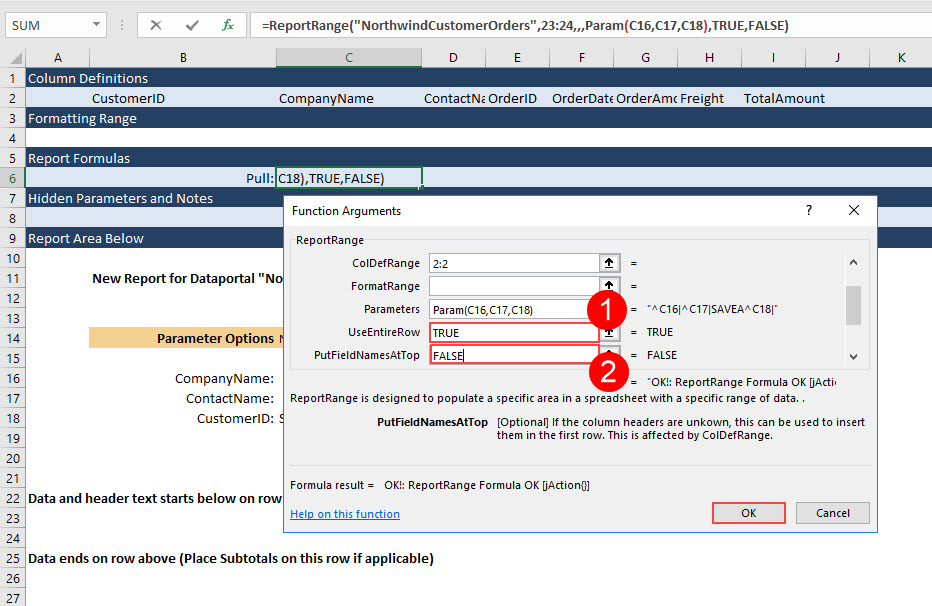
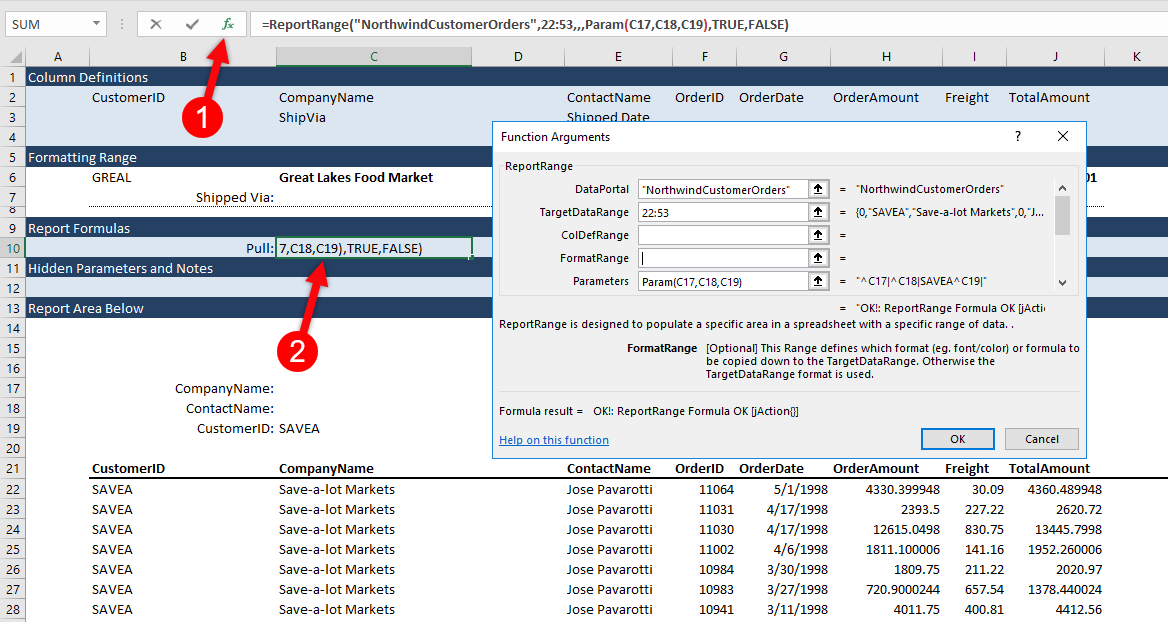
Step 1: For easy editing, open the function wizard by clicking on the function in cell C6 and clicking the fx button.
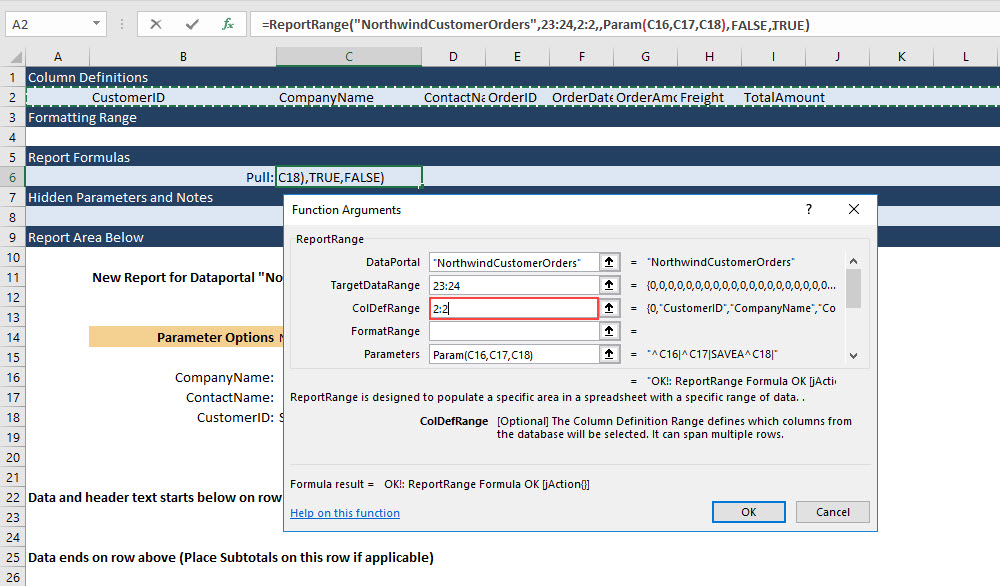
Step 2: First, set the ColDefRange to the second row (2:2) so that Interject knows which row is the Column Definition.
Step 3: Next, scroll down further in the argument list to change UseEntireRow from FALSE to TRUE. Also change PutFieldNamesAtTop from TRUE to FALSE. These are not required but are best practice.
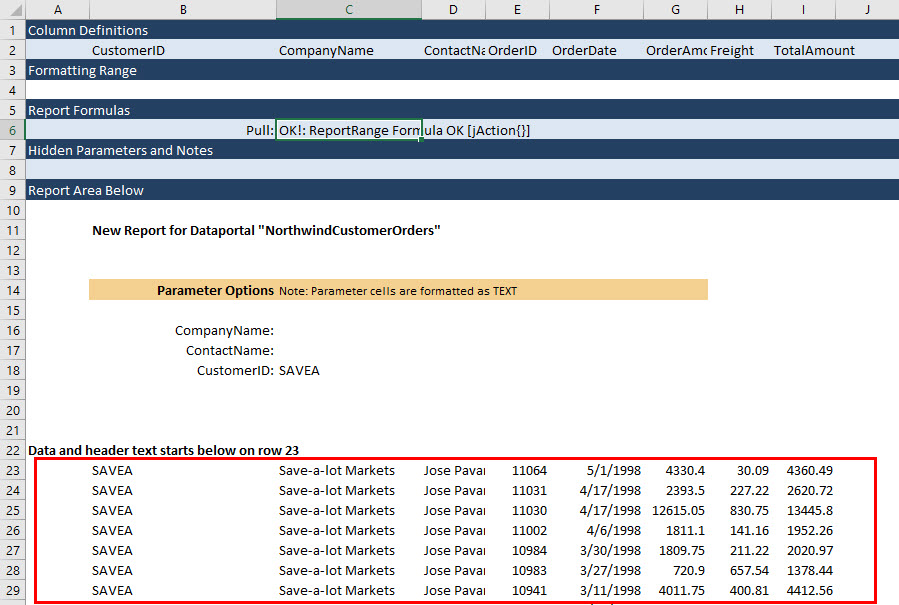
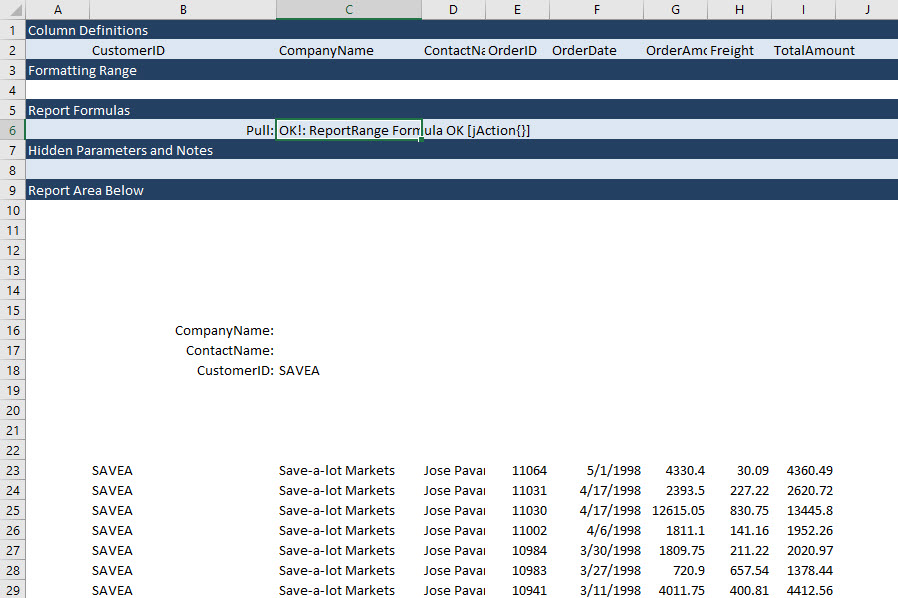
Step 4: Now pull the report to see the data.
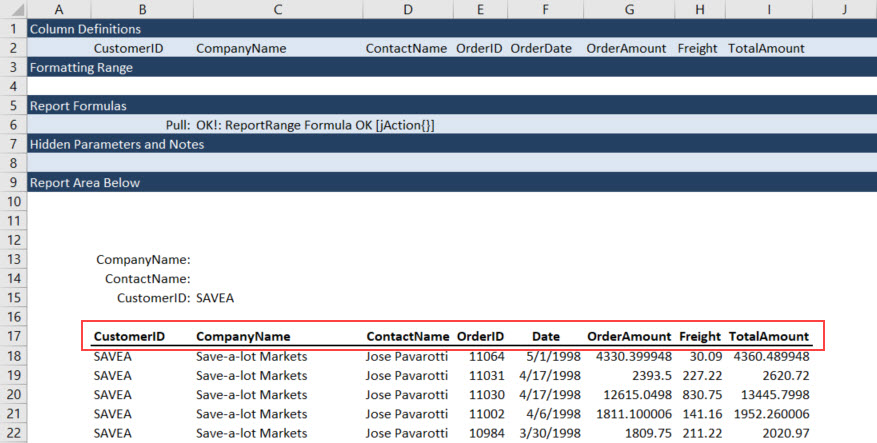
It should pull only the data for the columns you requested in the column definitions.
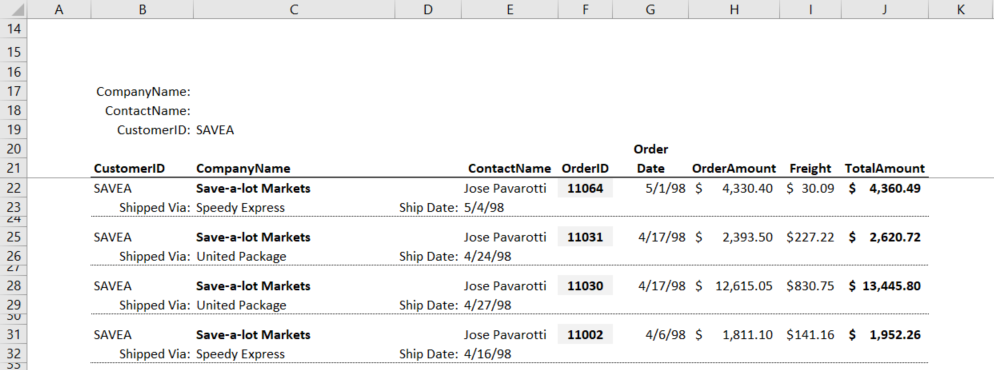
Step 4: Now that you have the data, remove any excess text and formatting not needed for the final report. Use the before and after screenshots to note what should be cleared.
Before:
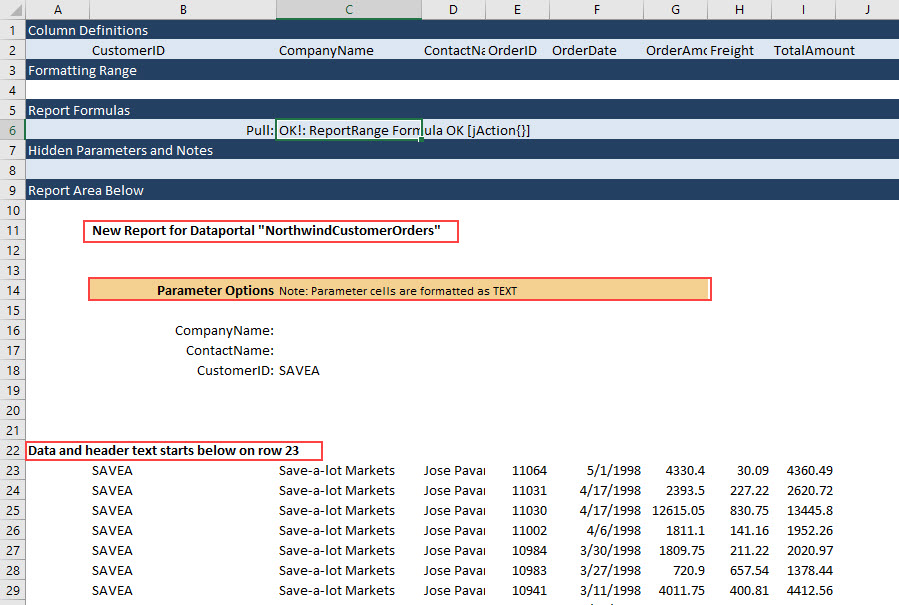
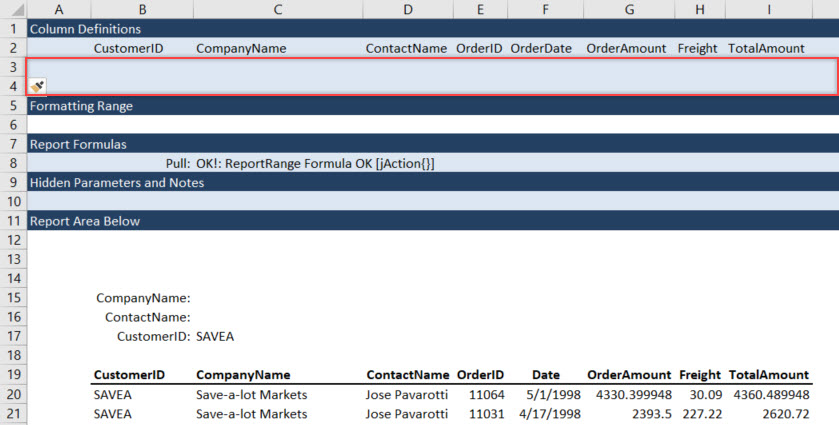
After:
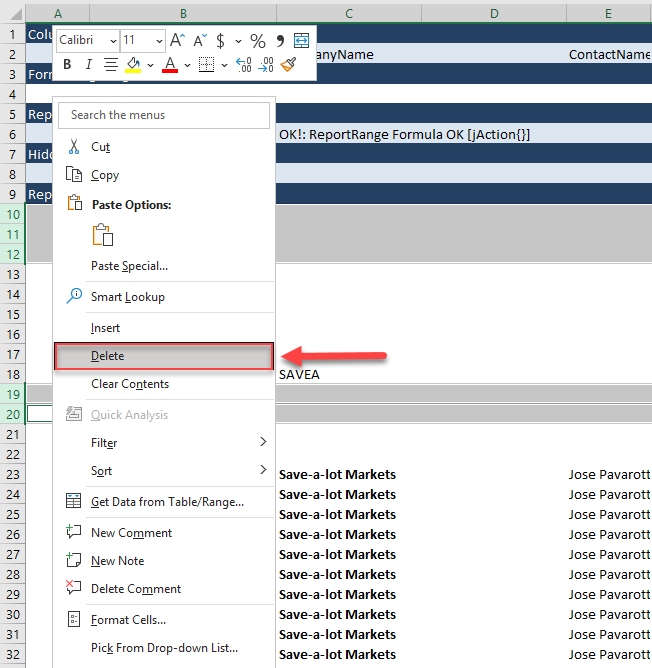
Step 5: With all the extra text gone, you can now remove the unneeded rows, 10:12 and 19:20.
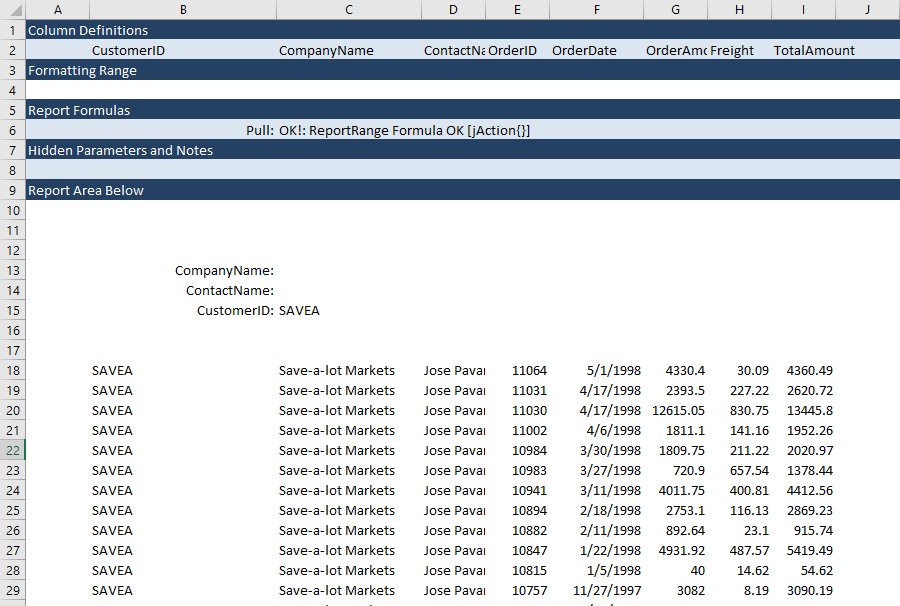
Before:
After:
Adding Multi-Row Range:
Continue adding column labels and applying the multi-row feature.
Step 1: To set up the column labels in row 17, copy the text from row 2 in the Column Definitions. You can change the column labels further, but the text is fairly descriptive.
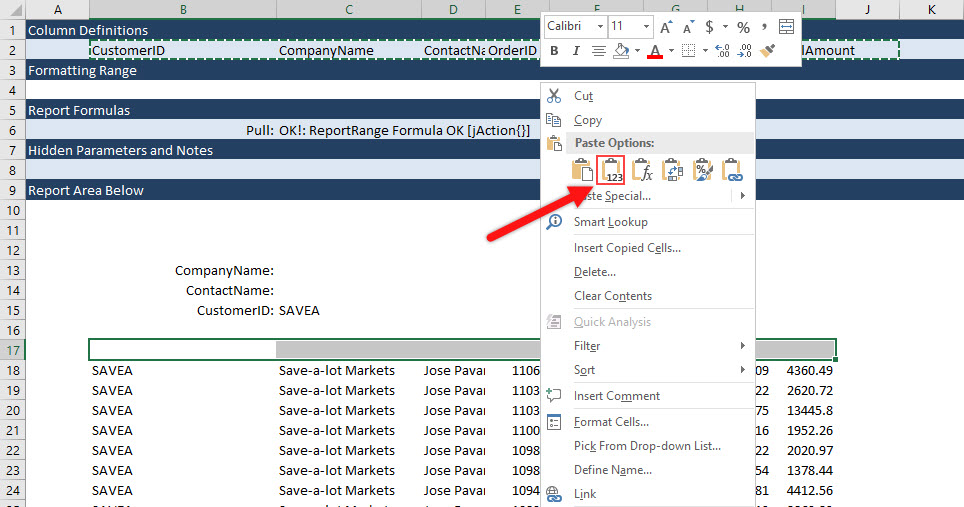
Then you can add bold and underline the headers to add emphasis.
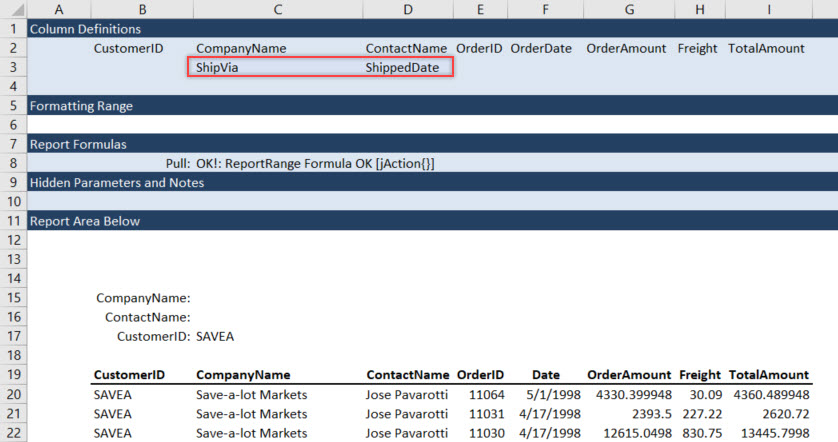
Step 2: Now set up the report to use three rows for every record returned. Navigate to the top of the page and insert two rows between row 2 and 3. The end result should resemble the image below.
Now add column definitions on row 3. You are going to add shipping information to the second row so the report does not have to be as wide. Leave the third row as a spacer between the next record.
Step 4: Next, you need to add to our formatting Range. Before now, you have not needed to setup a Formatting Range since it defaults to the first row where the data is placed. With a multi-row report, a Formatting Range is required. Just like with column definitions, first add two more rows to the section, as shown below. Whatever the formatting, formulas or values placed in the Formatting Range will be copied first to new data rows before the data is placed on the worksheet.
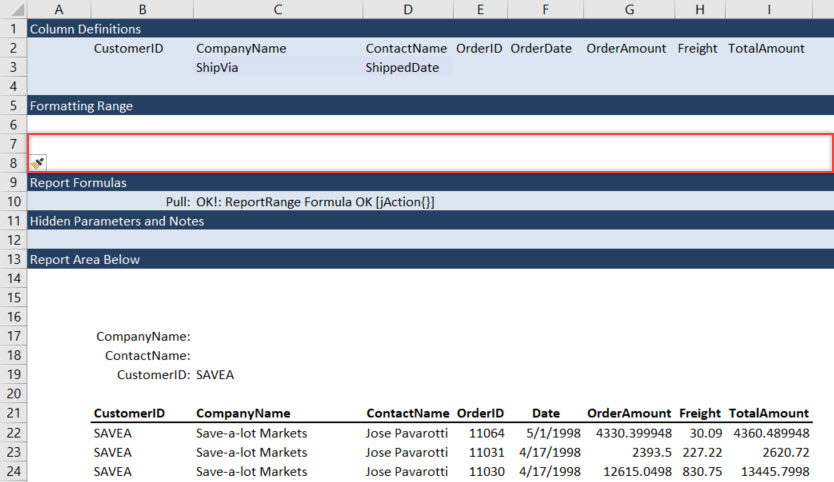
Below is an example of what a Formatting Range might look like (Note the column addition after Col C). It is okay to leave values there to visualize the formatting as long as it is understood the columns noted in the Column Definition will override the cells with data.
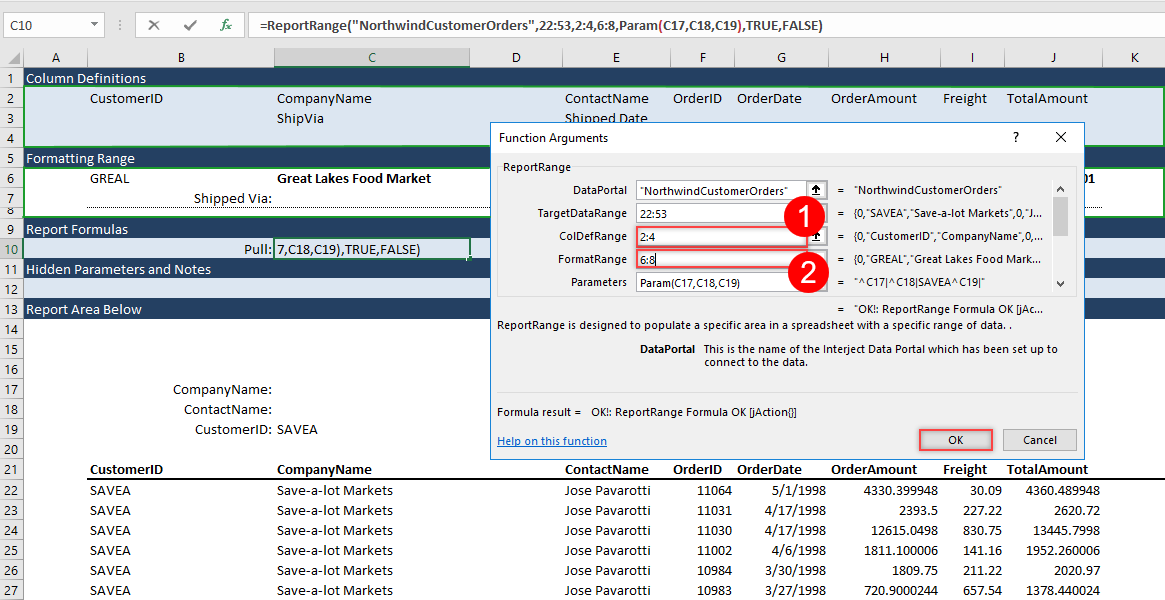
Step 5: Before pulling the data, you need to edit the ReportRange() Formula in C10 so that it uses the Column Definition and Formatting Range set in the previous steps.
Set the ColDefRange to 2:4 and FormatRange to 6:8 as illustrated below.
Step 6: Now pull the data to see how it looks!
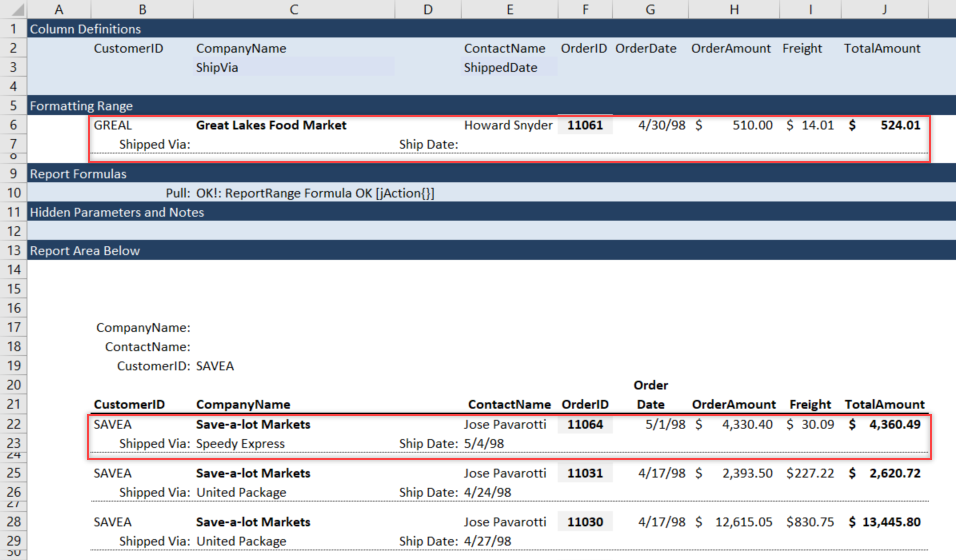
The report should look something like this. Note that the text gets overwritten with the data pulled by Interject. However, the formatting, row size, text type, and text that does not coincide with the column definitions stay the same.
Final Steps
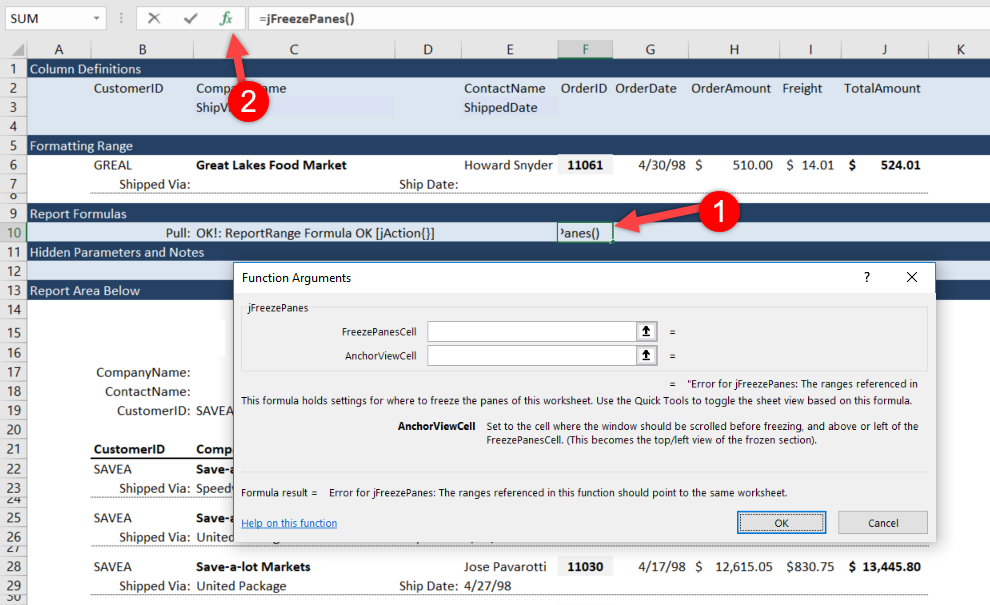
Step 1: Now setup a jFreezePanes function so you can quickly unfreeze and freeze the panes at the correct position. First, setup the jFreezePane function in cell F10 by going into the report formulas section and typing =jFreezePanes(), then click the fx button to open the Formula Wizard.
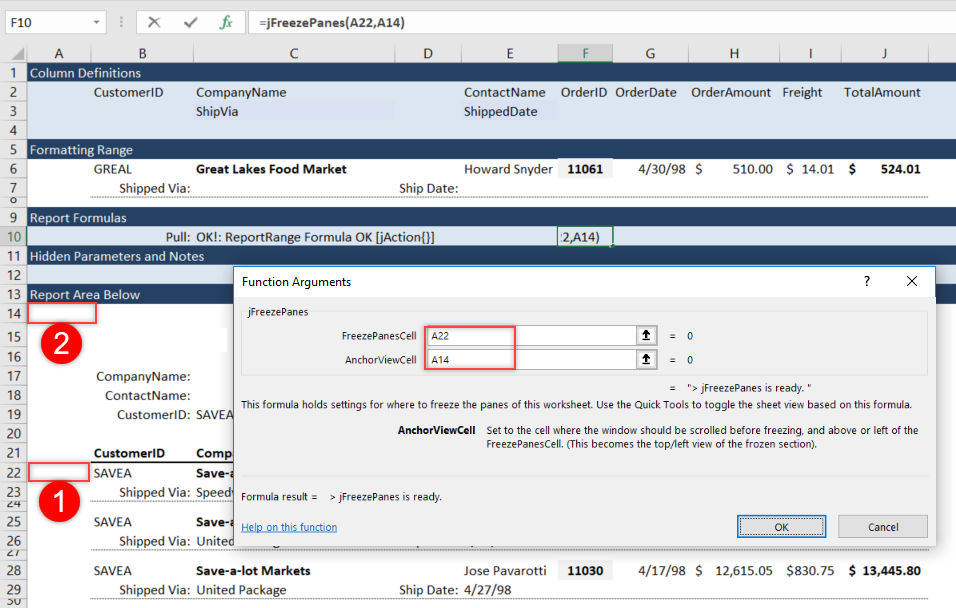
Step 2: In the FeezePanesCell argument, input A22. This will set the row that will be frozen above A22, and also where you will place the column headers. For the AnchorViewCell argument, type in A14 to mark that row as the top of the visible report. This sets the top of the report that will be visible to the user.
Step 3: Use JFreezePanes to toggle panes off and on. Go to the Quick Tools menu in the Interject Ribbon, then click Freeze/Unfreeze Panes.
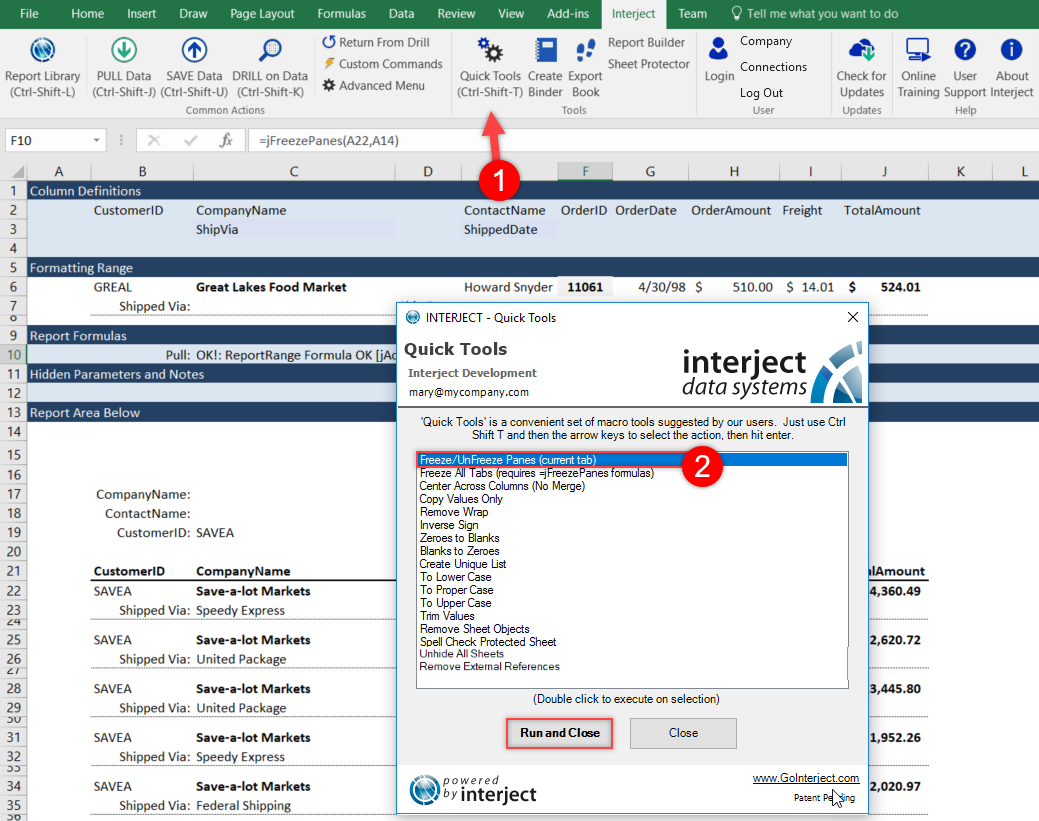
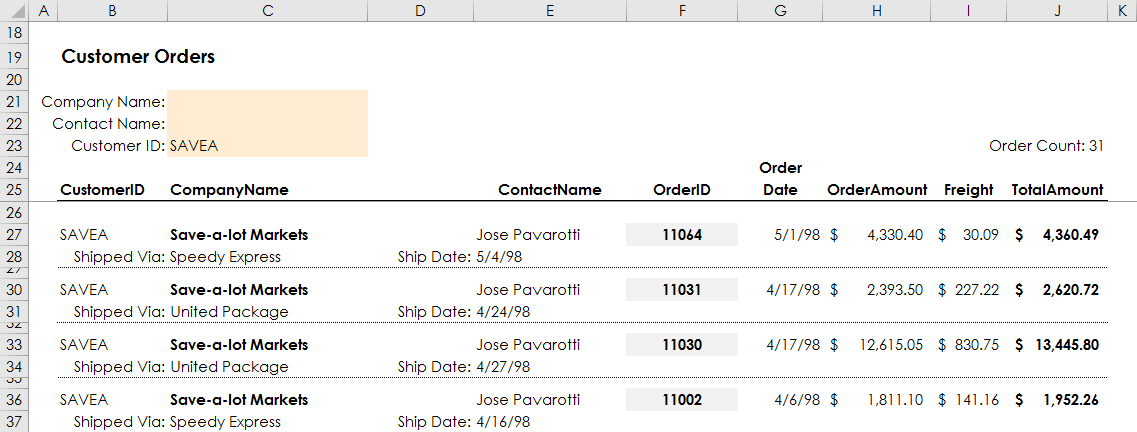
This will freeze the panes, and the report will look something like below.
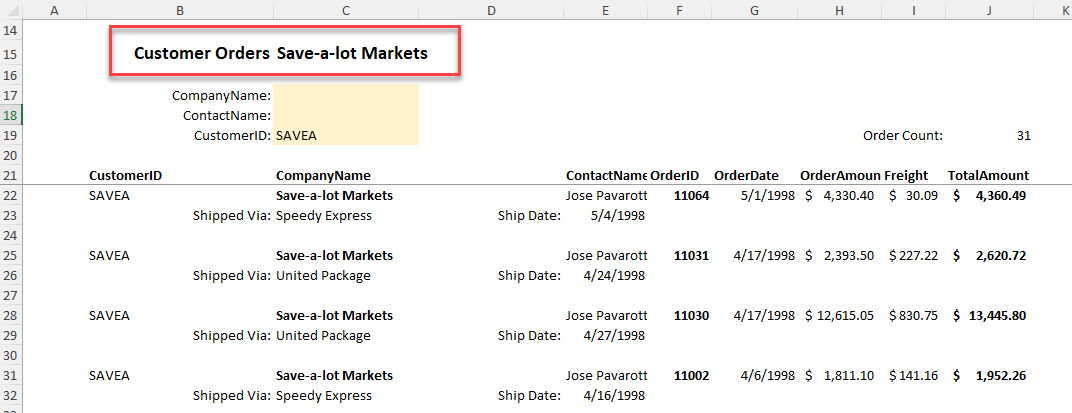
Every report will be specific to the company's needs and best practices, but a completed report should look like this:
Finally, clear the report and save the file to the Report Library "My Favorites" folder. (For detailed instructions on how to save a file to the Report Library, see here.)
Adding a Report Label With ReportLookup
The ReportLookup() function is great for pulling in a single piece of data into your report. Here we will use it to generate a label for the report based on the CustomerID entered in cell C19.
Step 1: In cell I10, enter the following details:
=ReportLookup("NorthwindCustomers",C15,C2,Param(C17,C18,C19))
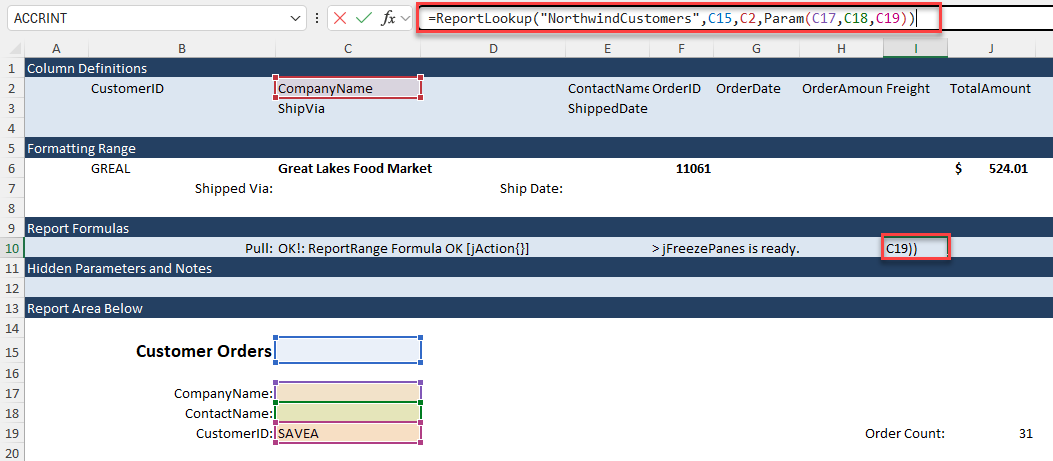
This will pull from the "NorthwindCustomers" data portal and pull the Company Name of the CustomerID entered in C19. It will insert this into cell C15.
Pull the data again to see the report label inserted: