Basics of Report Formulas
Estimated reading time: 10 minutesOverview
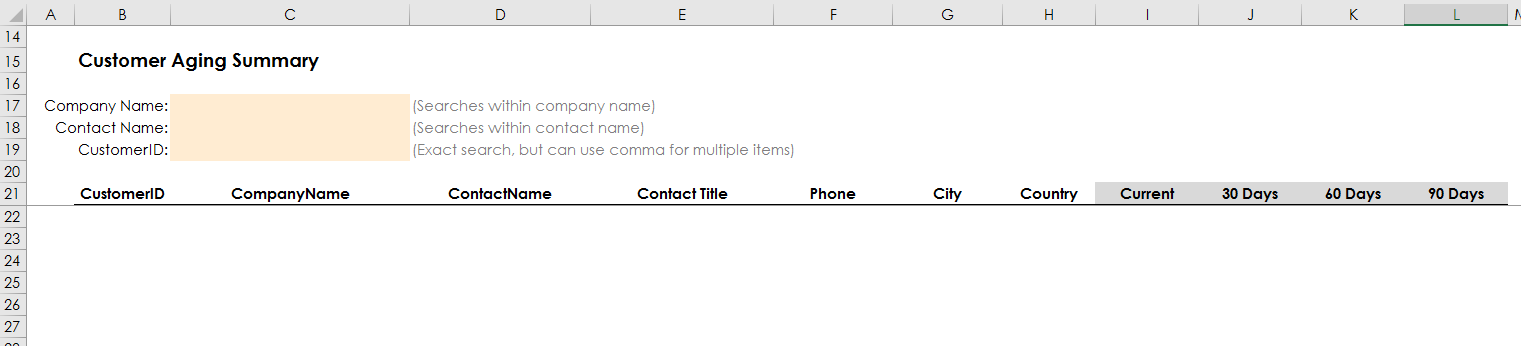
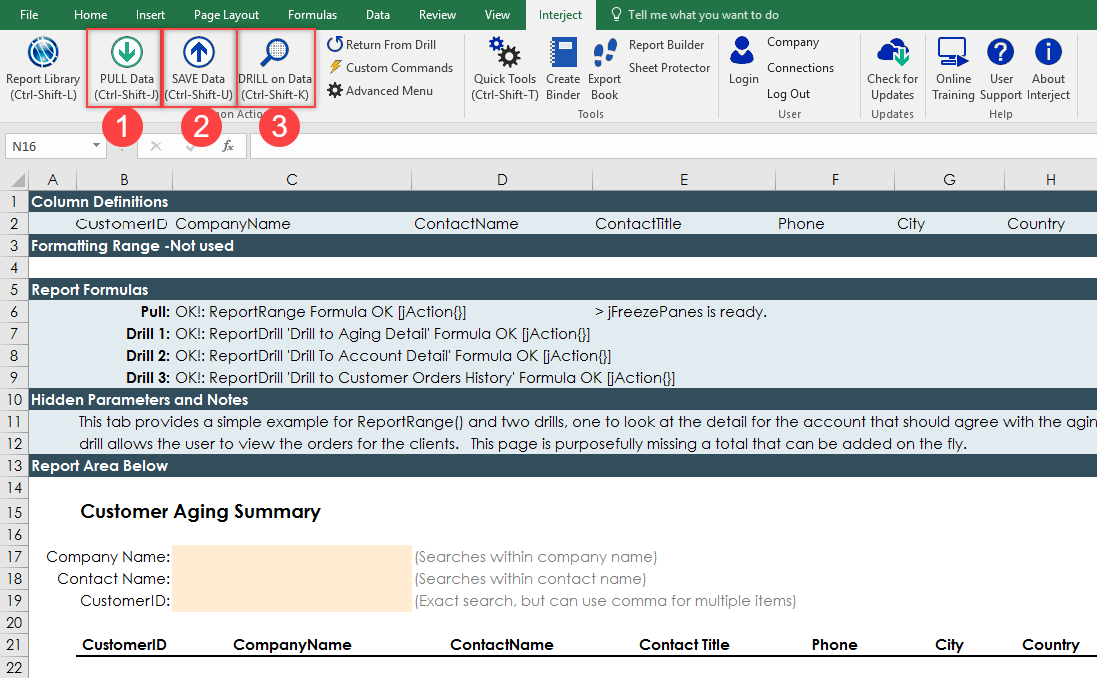
Inside Interject tabular reports there is a hidden configuration section at the top of the worksheet. Notice in the following screenshot how the Customer Aging report from the Walkthrough begins at row 14? Above row 14 is a section devoted to the report configuration. The Report Formulas section is a common place where Interject Report Formulas are added to direct the behavior of the report. Most users of reports will not have any need to view this area. For advanced users, there are various reasons to access these formulas.
If you are following the Training Labs, this report file can be found in the Report Library at Training Labs > Lab 2 Modifying Reports > Lab 2.1 Basics of Report Formulas.
Accessing the Report Formulas
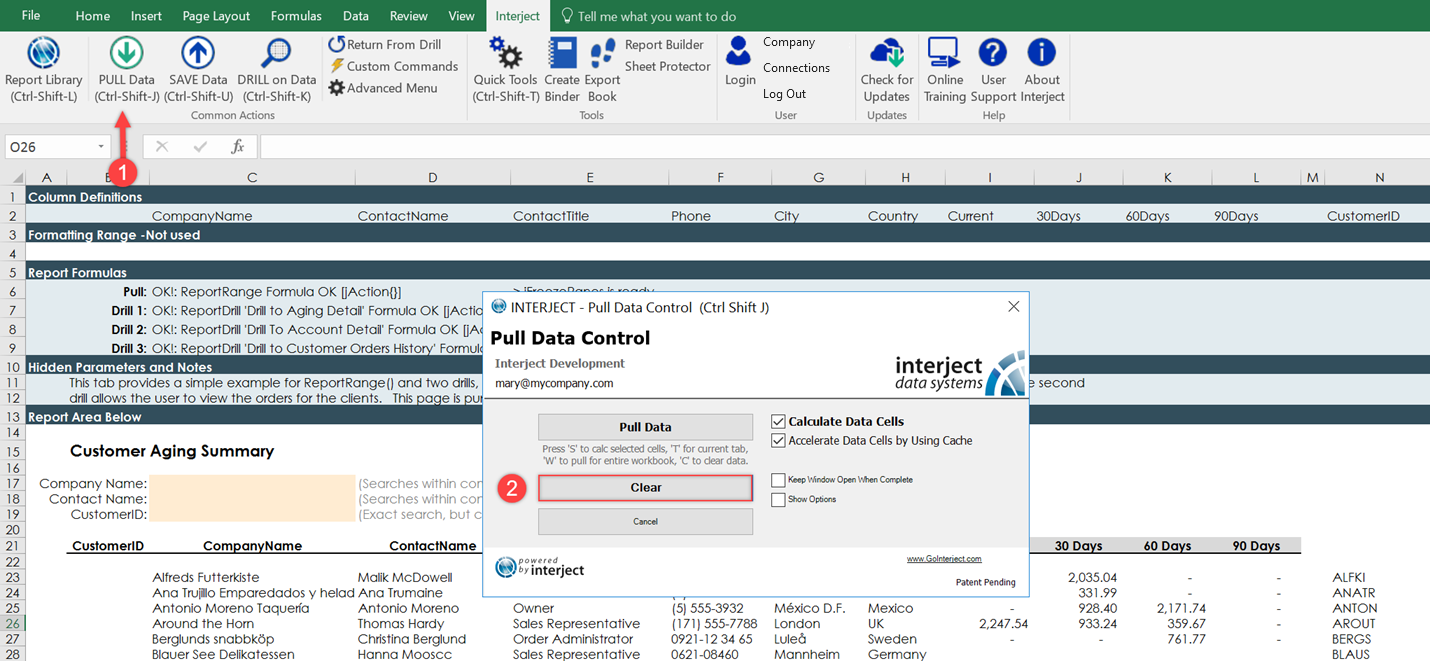
Step 1: For this walkthrough, you will use the Customer Collections report located in the Interject Demos folder of the Report Library.
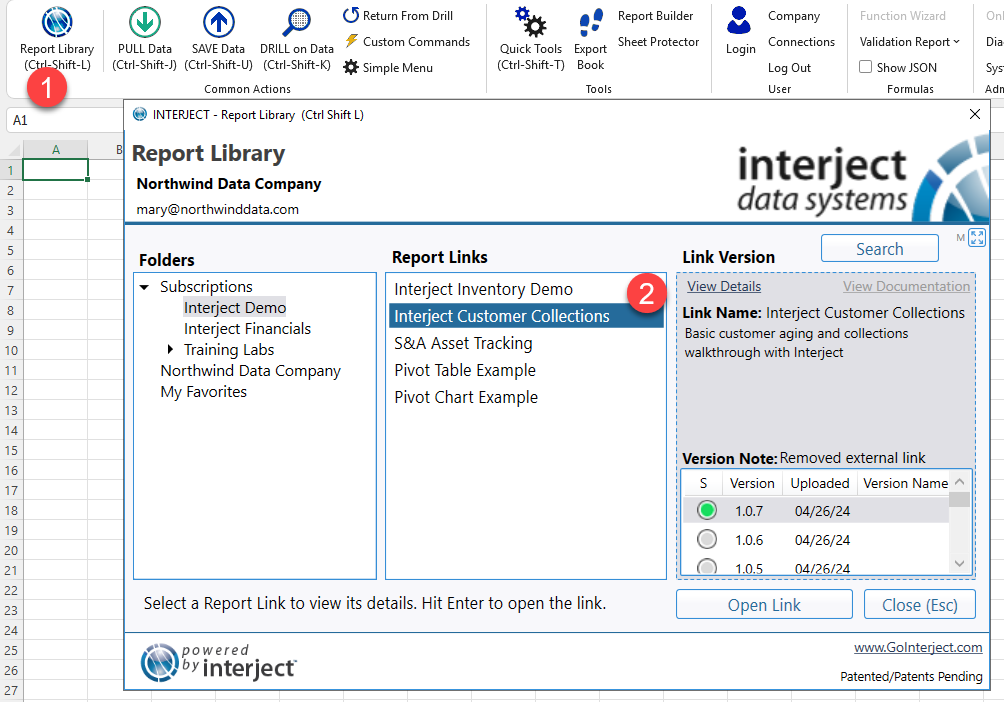
When the report is opened it will be blank. It is ready for any filters before pulling data.
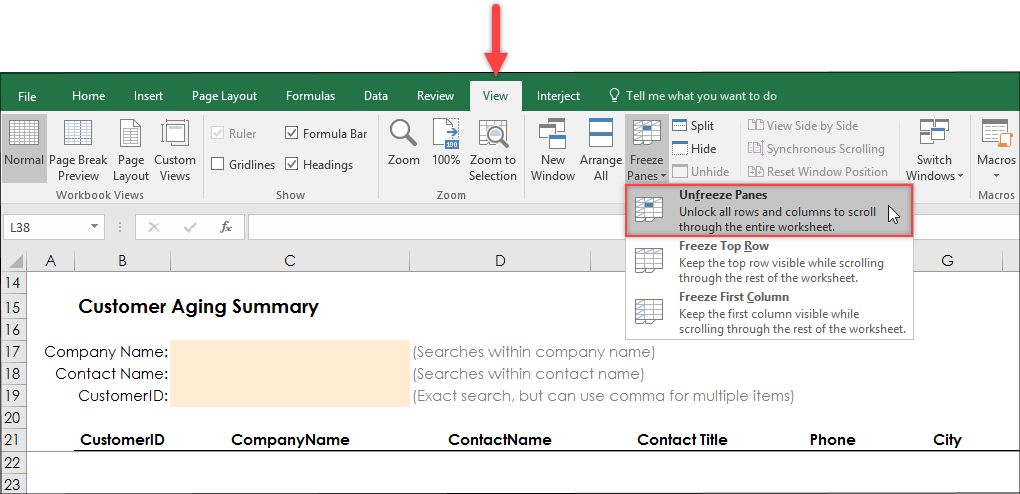
Step 2: To see the formulas working behind Interject, you need to Unfreeze the panes hiding them. Select the View ribbon and select the Freeze Panes drop-down. Then choose the first operation, Unfreeze Panes.
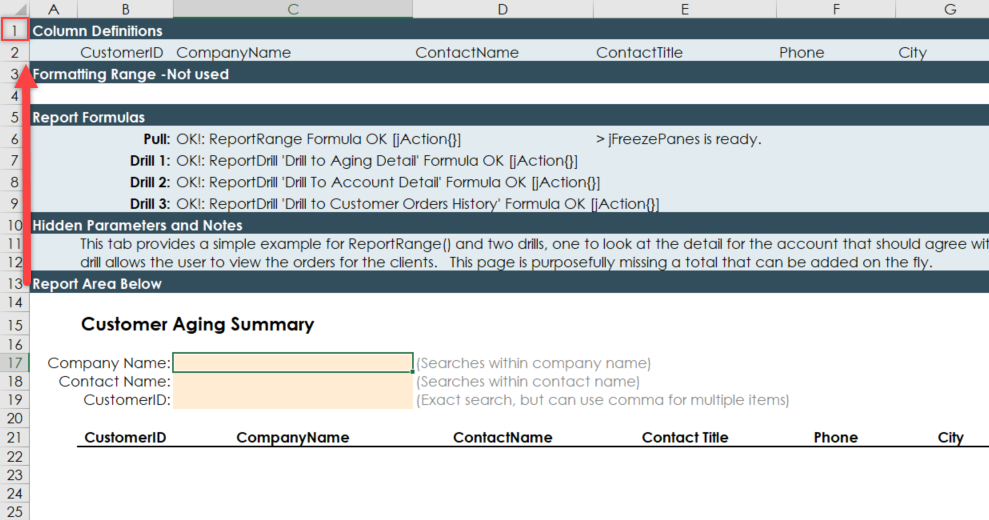
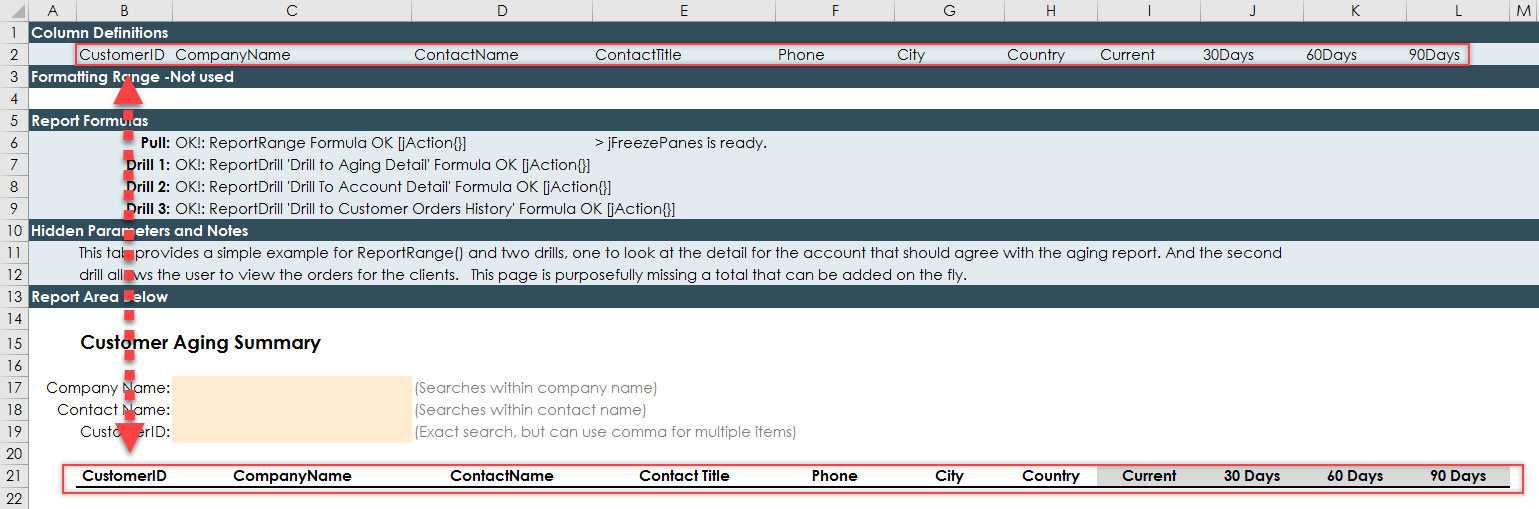
Step 3: Now scroll up and see the Report Formulas section of the report. Notice that now all the rows are visible, starting at row 1.
Column Definitions
Column Definitions define which columns of a spreadsheet will be populated with data. This is how Interject knows where to place data within the spreadsheet. Moving column definitions will change where data is placed the next time it is pulled.
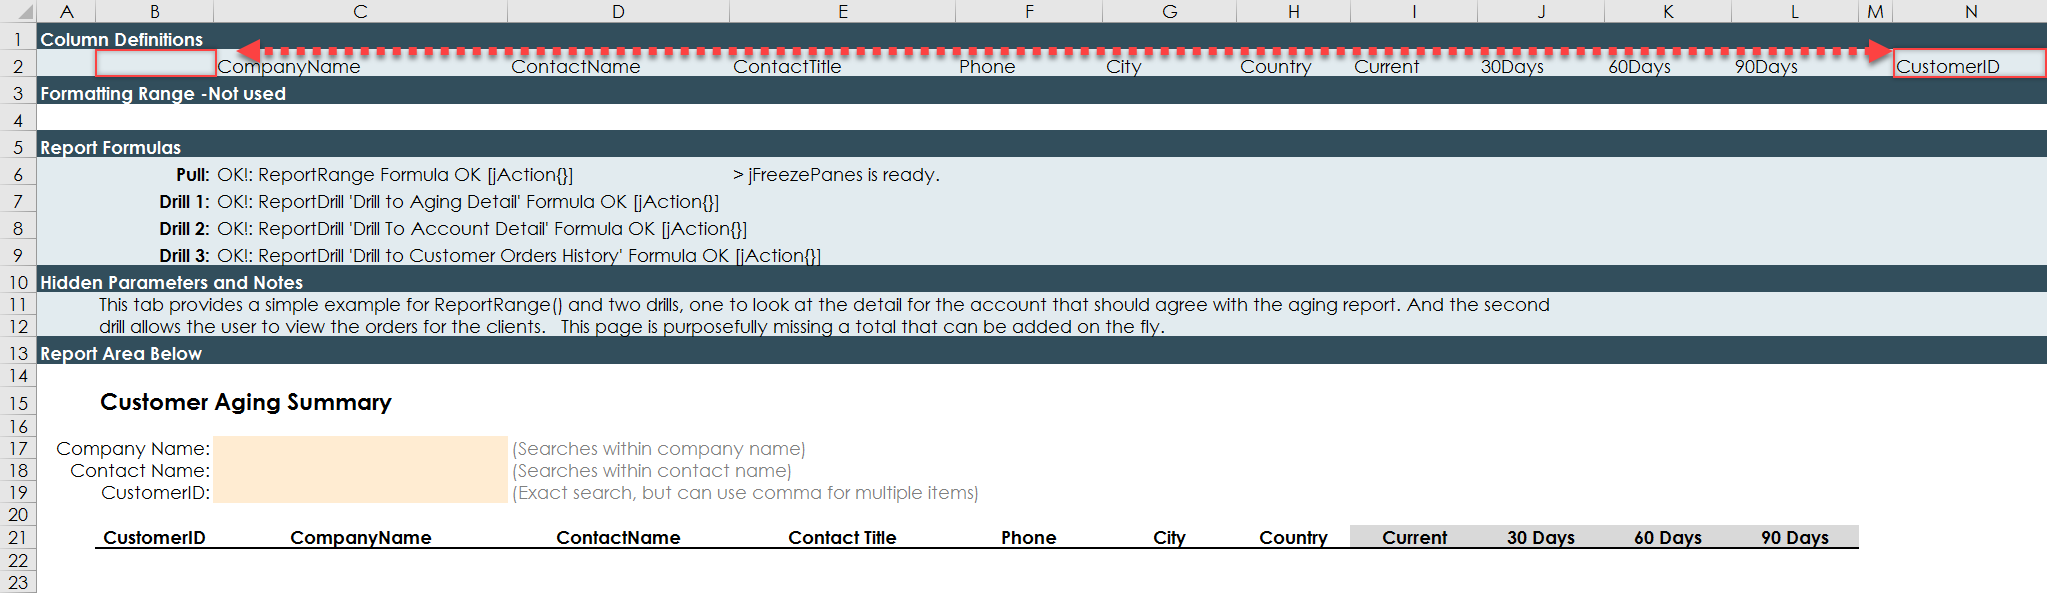
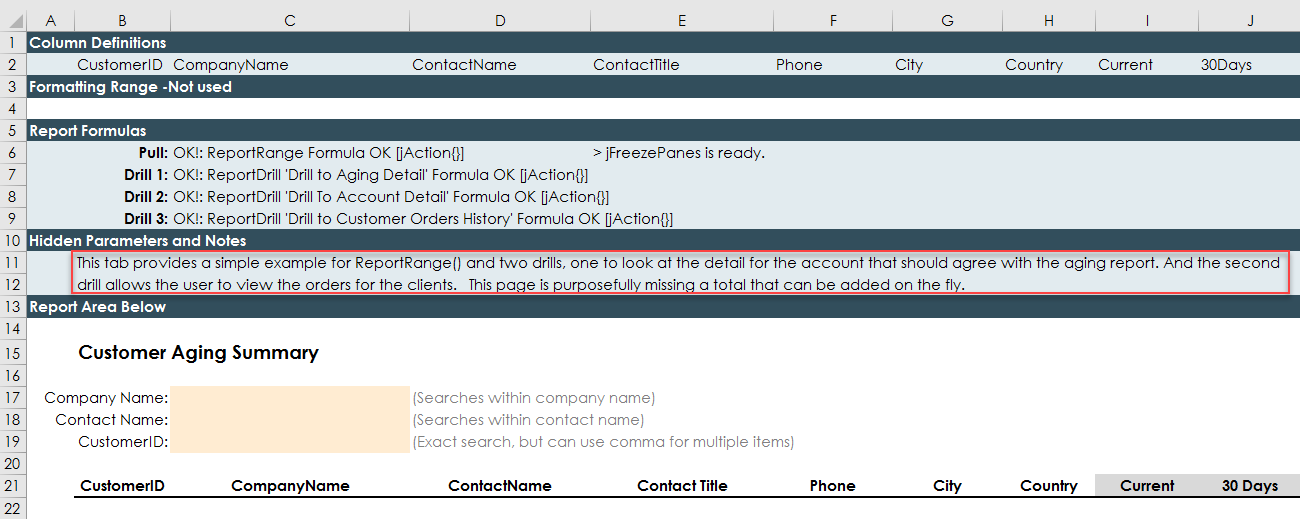
You have full control of what column labels that are shown in the reports. Notice that the column labels in row 21 are directly below the coinciding column definition in row 2. Since this column label row is displayed for users, you can make the text more readable by, for example, adding spaces for the column name 30Days to show in the report like 30 Days .
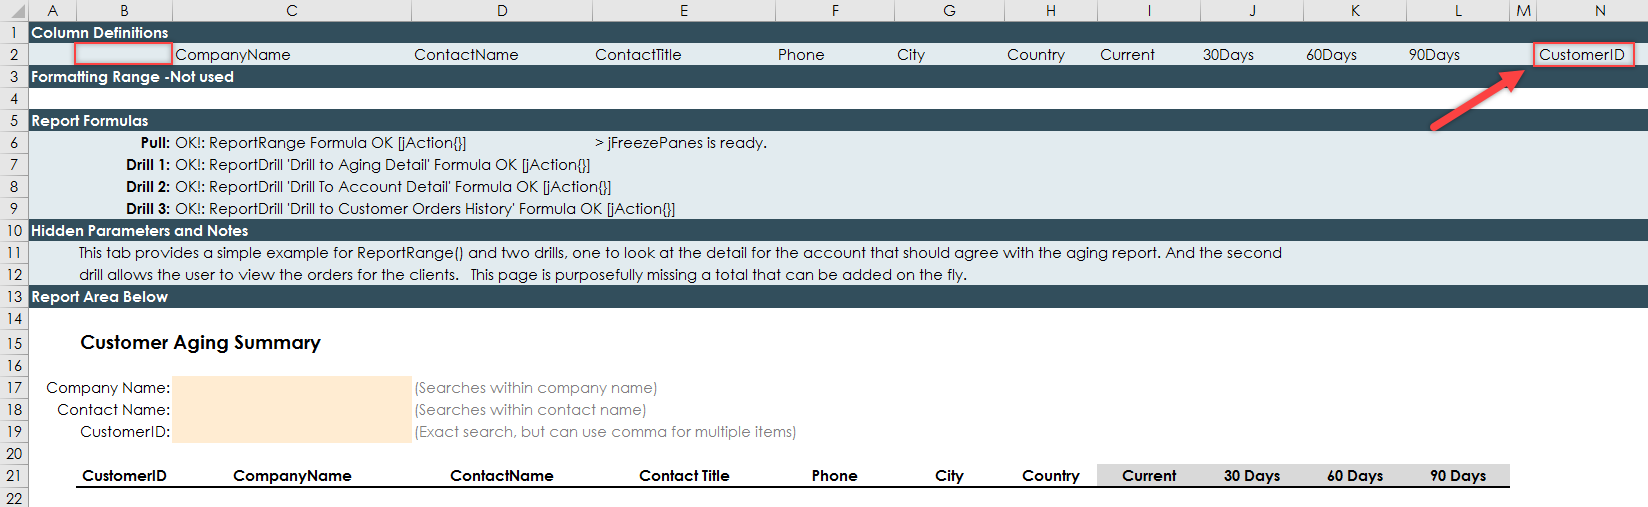
Step 1: Interject uses the column definitions in row 2 to determine where data is placed in the report. The labels in row 21 are ignored. To show this, move the CustomerID label in row 2 and place it in Column N, but do not move the column label in row 21.
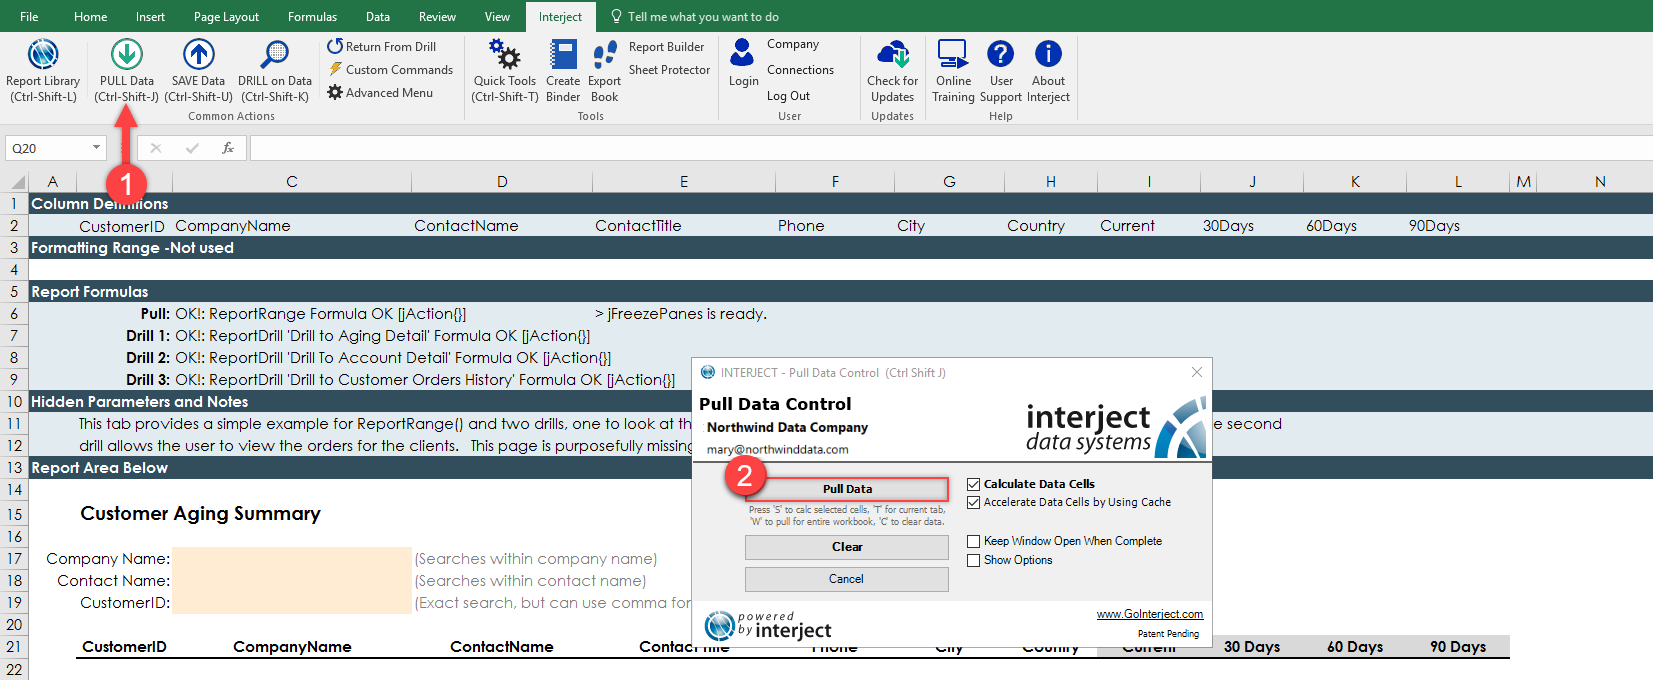
Step 2: Now use Pull Datato see where the CustomerID data is populated.
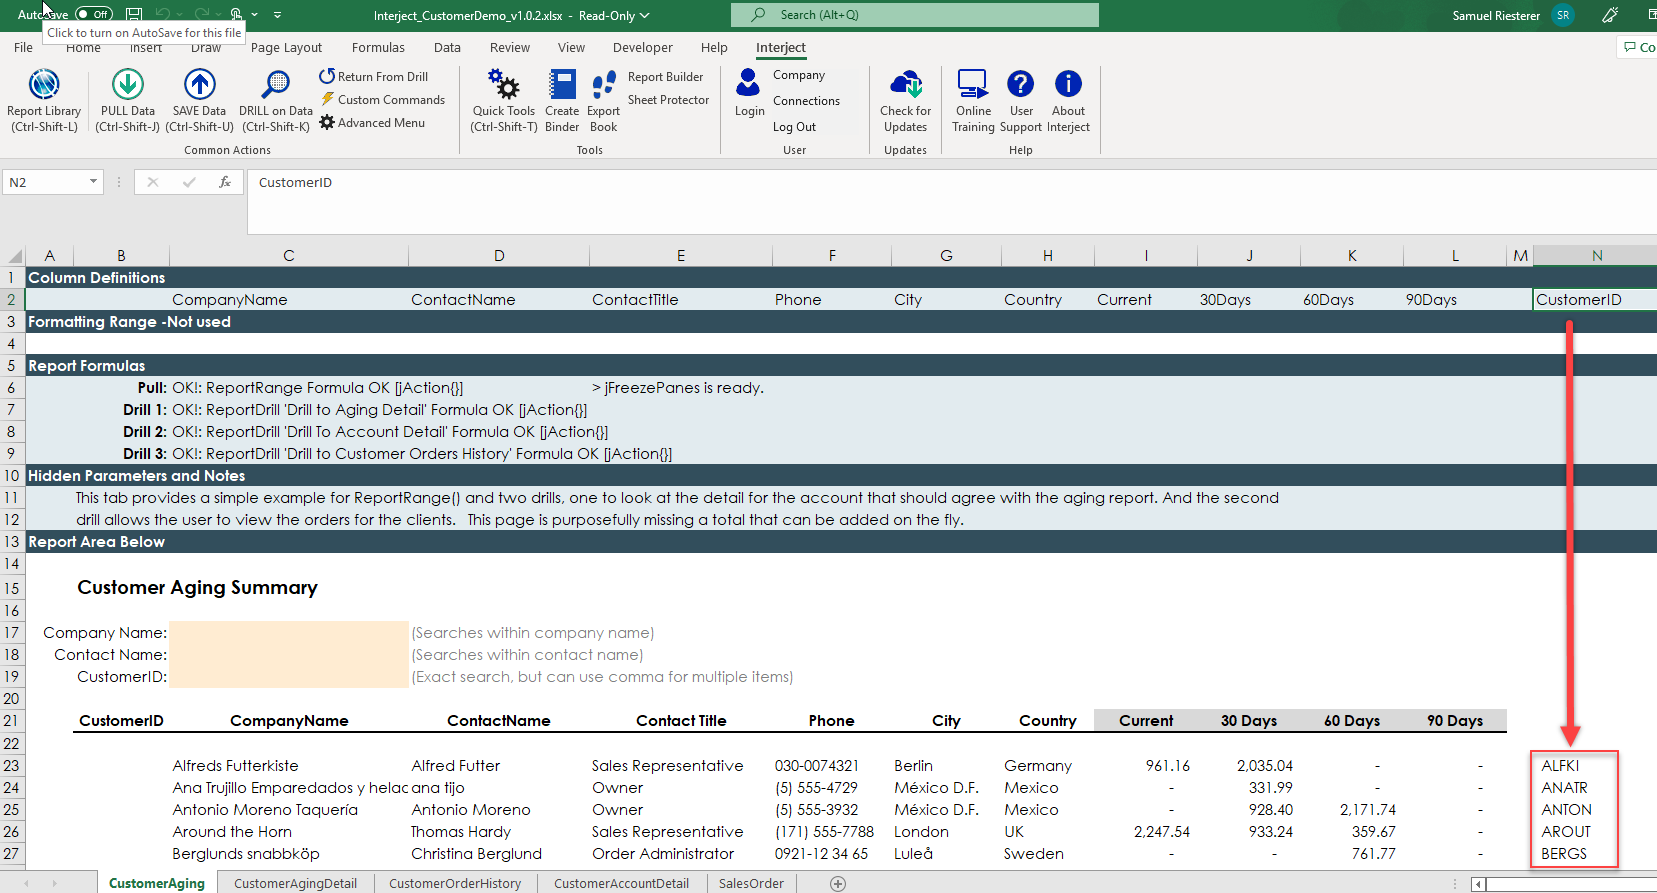
Notice that the CustomerID data is populating column N below the column definition.
Step 3: Put the CustomerID back where it belongs in Column B. First, clear the report so you can remove the CustomerID data already in column N.
Step 4: Move the CustomerID column definition value back to cell B2.
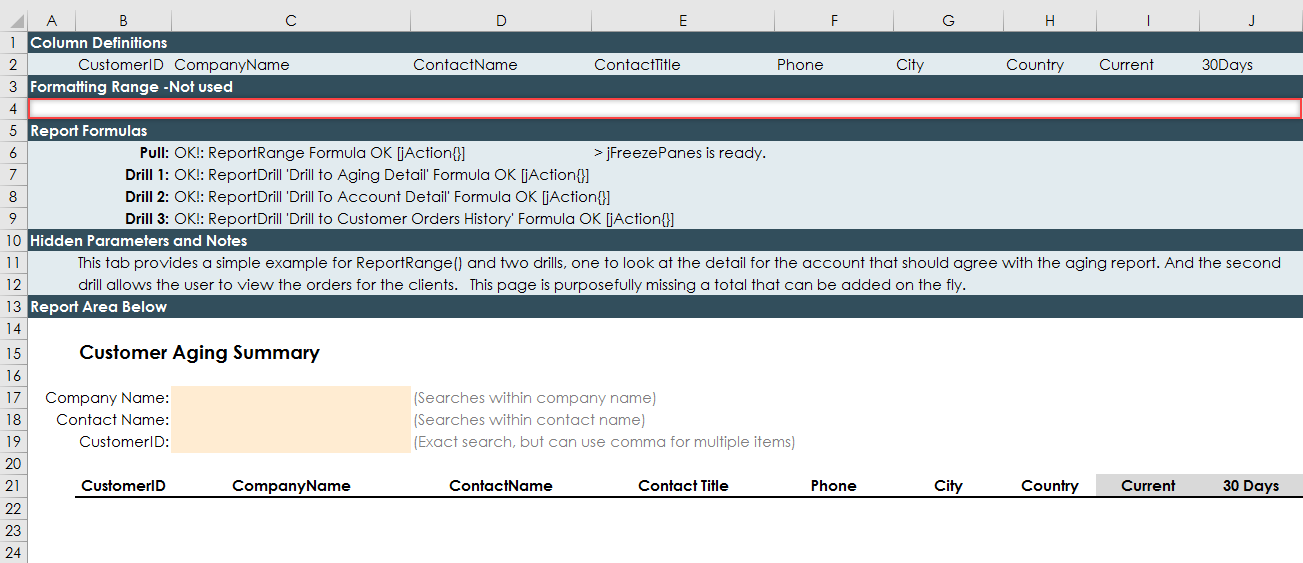
Formatting Range
The Formatting Range is the place designated to hold the formatting and formulas that will be copied down with the data in the report. When the report is populated, the formatting range is first copied down to the new rows in the report, along with any input text or formulas. Then the data specified in the Column Definition area is placed in the respective column. It is important to note, if the reporting range has values or formulas in the same column as the Column Definitions, it will be replaced with the data.
A Formatting Range configuration is not required. If one is not specified in a Report Formula (discussed below), then the first row in the report is considered the Reporting Range.
Report Formulas
Report Formulas are a big part of how Interject directs data in and out of the spreadsheets. For example, you can see here that the Customer Aging Report contains 4 formulas, a pull and 3 drills.
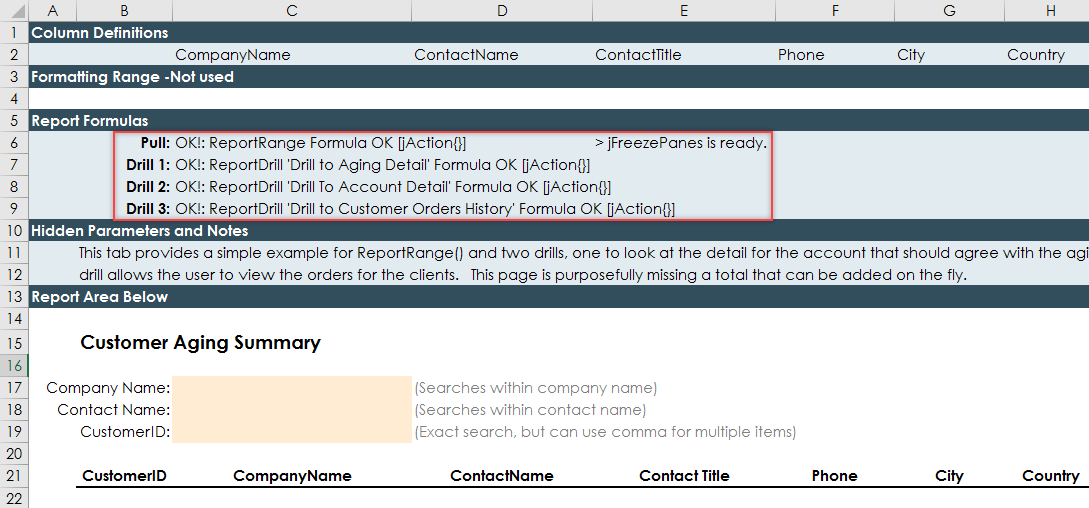
The first formula is a Report Range formula and will pull the data from a data source to the spreadsheet. There are other Interject report formulas to pull data (see Data Pull Functions). You will look at these later. The screenshot above also shows three ReportDrill() formulas that enable drill functionality. A drill lets us navigate to another spreadsheet report based on the context selected.
Another type of Report Formula is the Save formula, which is not shown here. This type of Report Formula enables an application developer to build save back features into our reports, such as saving back comments on financial variances to a central database so they can be presented in other reports.
Each of these formulas is activated by its corresponding button in the Interject Ribbon menu.
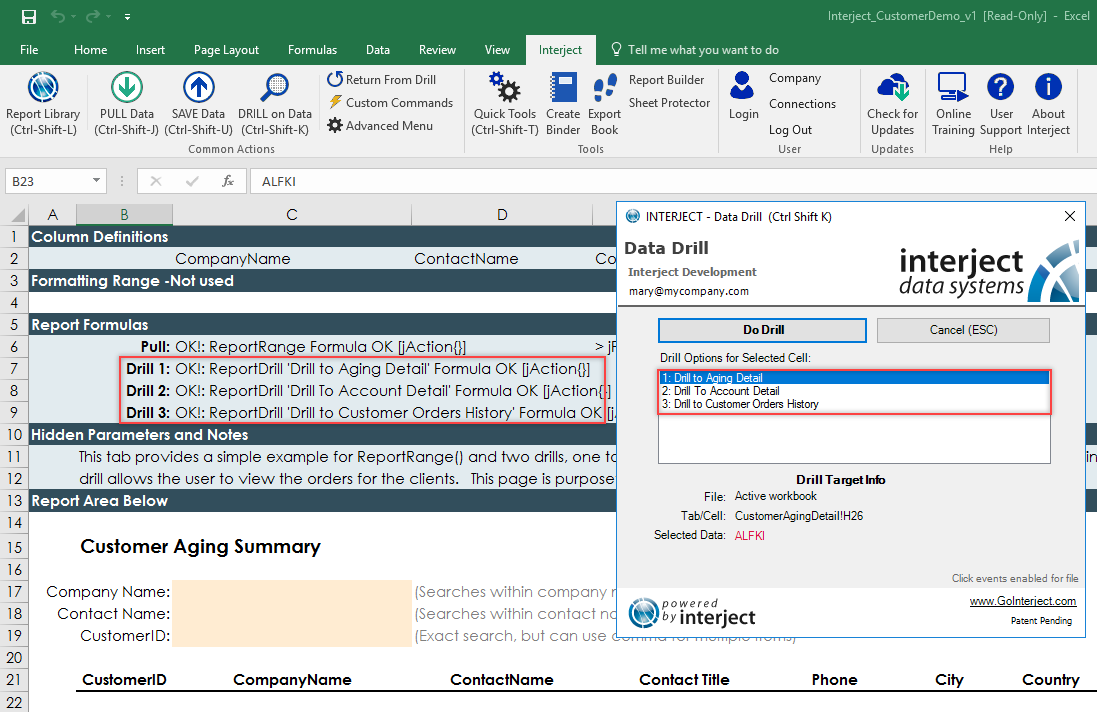
If a report has multiple Pulls or Saves, Interject will activate them in order from left to right, for the first 1000 rows of the spreadsheet. If a report has multiple drills, Interject will show a popup list for you to select one specifically. The order of drills in this list will be based on the order of the drills in the report, from left to right and top to bottom.
Hidden Parameters and Notes
The Hidden Parameters and Notes section has two uses. First, it holds documentation on the configuration for other report writers to see. Second, it can contain hidden parameters and spreadsheet formulas that support the other areas of the spreadsheet report. In this example, the notes contain a basic overview of the report as well as what the drills do.
This concludes the discussion of the basics of Report Formulas. Be sure to continue reading, since there are many advanced options to learn more about, which can be leveraged to create tailored reports and applications for the company's needs.