Create: Using the Retain Feature
Estimated reading time: 12 minutesOverview
Interject provides a retain feature so that you can update the data in a report without deleting rows, keeping your formulas and other information intact. Typically, when using Interject to pull data into your spreadsheet, the report area will be cleared before new data is inserted. This is typically done by the deletion of rows. In some situations, you may want to avoid this clear action in order to retain some formulas or other information, since pulling could remove formulas you have on other columns related to certain data rows. This is especially true when you are budgeting or forecasting with historical numbers. The report may have history on the left and your forecasting formulas and numbers will be input on the right.
Since Interject must still update your data, it must determine which columns act as the key values, so it can place the correct data in the correct row. By specifying these key columns in the RetainRowColumns parameter, Interject will retain any row of data where there is a value in these columns. Consequently, on a Pull-Clear action, Interject will not delete these rows but instead zero the amounts.
Interject's retain feature is available for the ReportRange() and the ReportVariable() functions.
This example shows how to use the retain feature in your reports. It uses the PL Trend report found in the Report Library under the Interject Financials folder.
If you are following the Training Labs, this report file can be found in the Report Library at Training Labs > Lab 5 Advanced Features > Lab 5.5 Using the Retain Feature.
Create Simple Formulas
Step 1: To start, copy the columns L-N in the PLTrend tab and paste them into Column P-R.
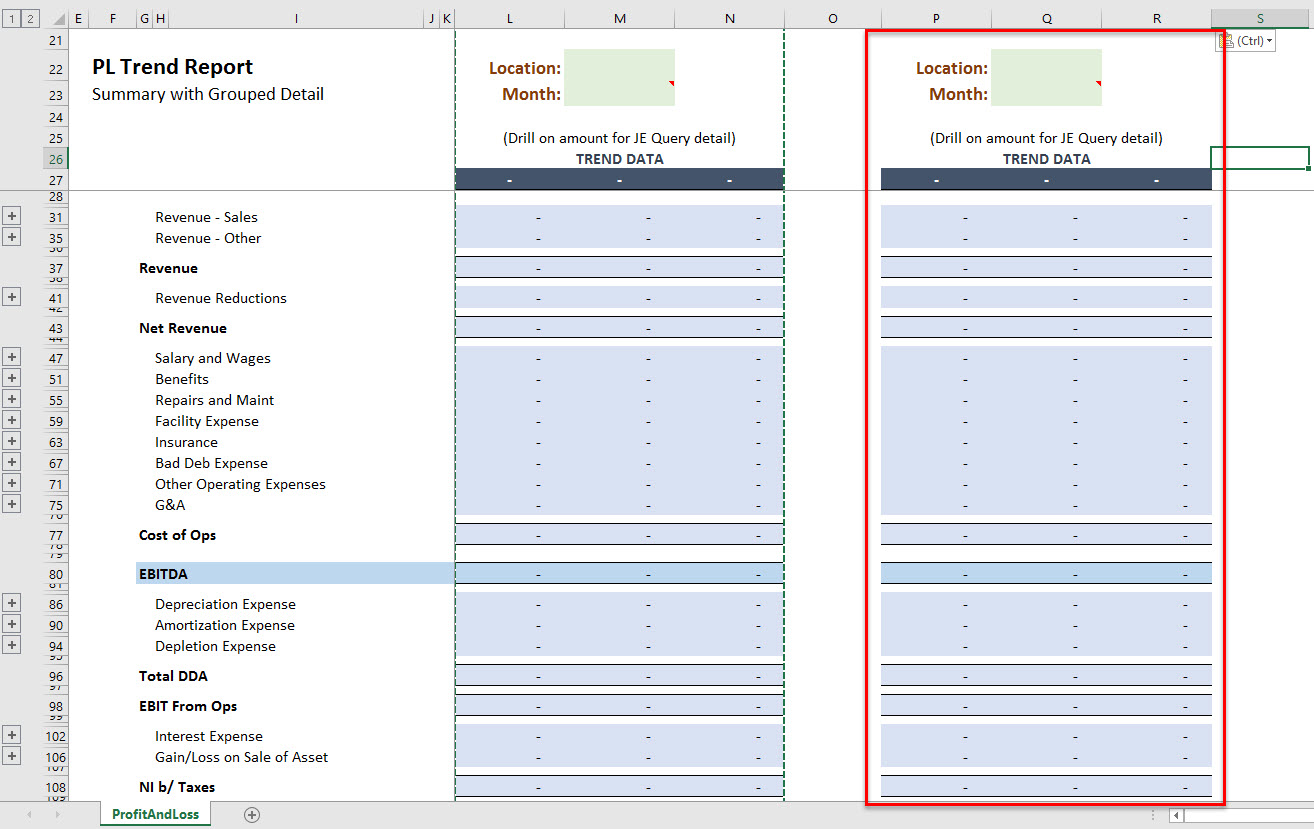
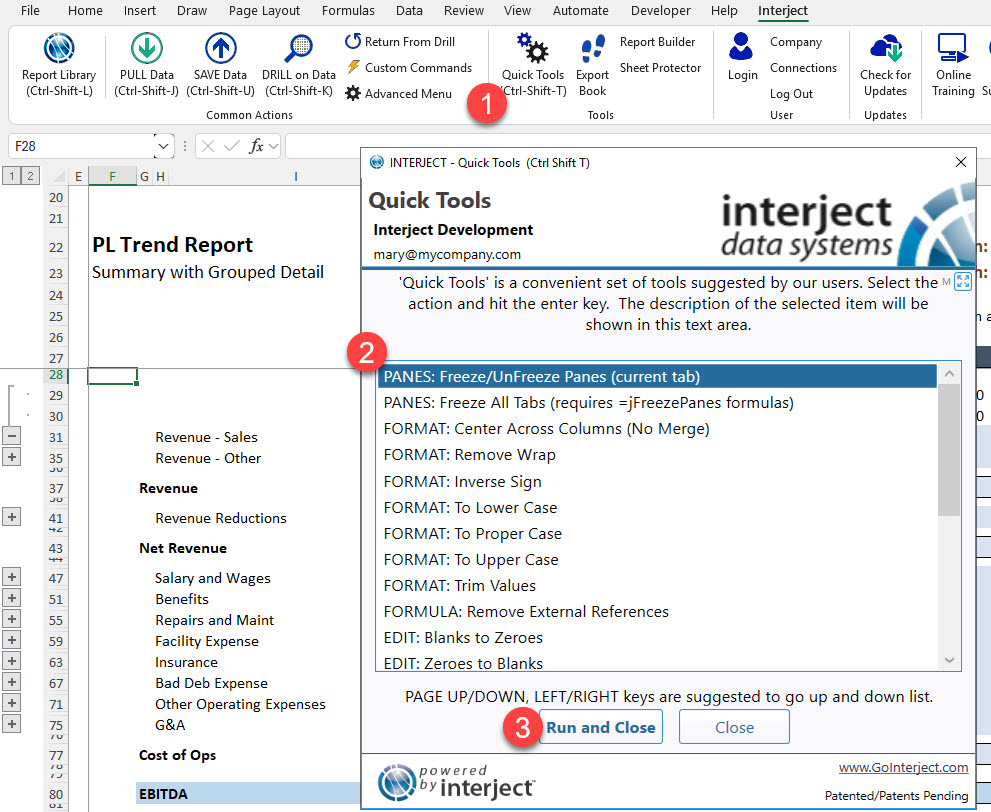
Unfreeze the sheet.
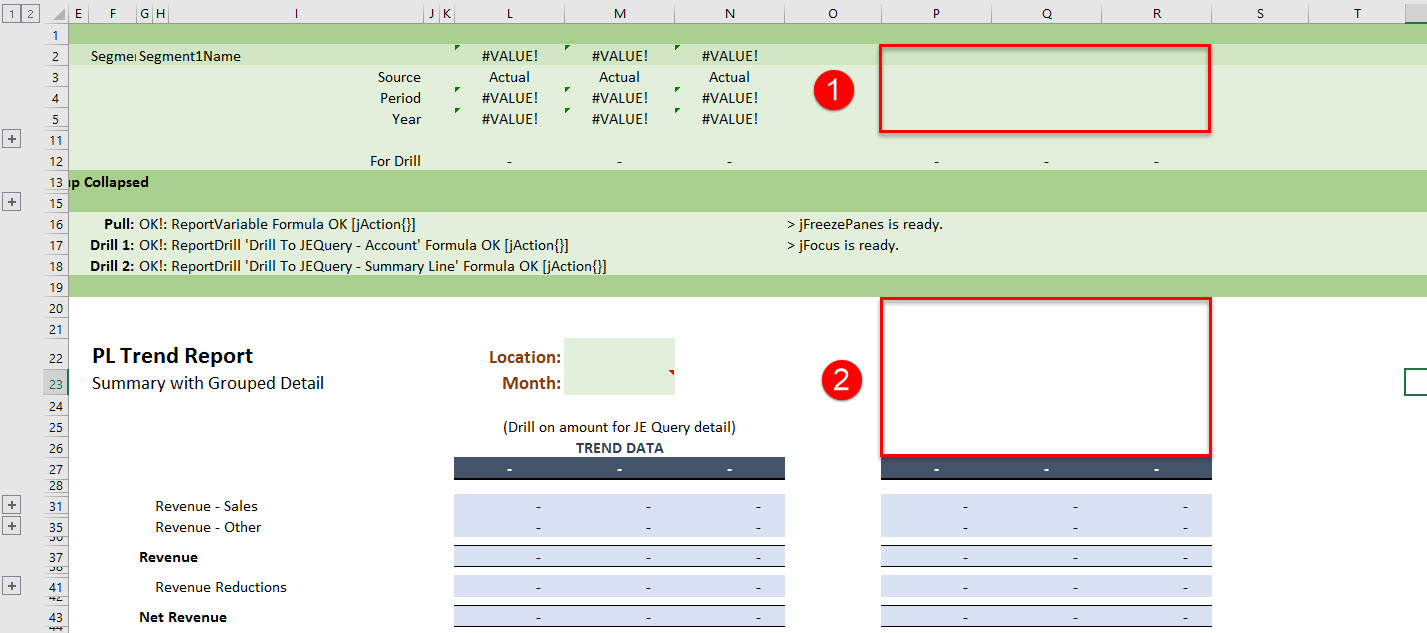
Step 2: Clear out the cell range P2:R5 from the new columns so new data does not populate on the right side. This is also a good time to clear out the extra input spaces in the P20:R26 cell range.
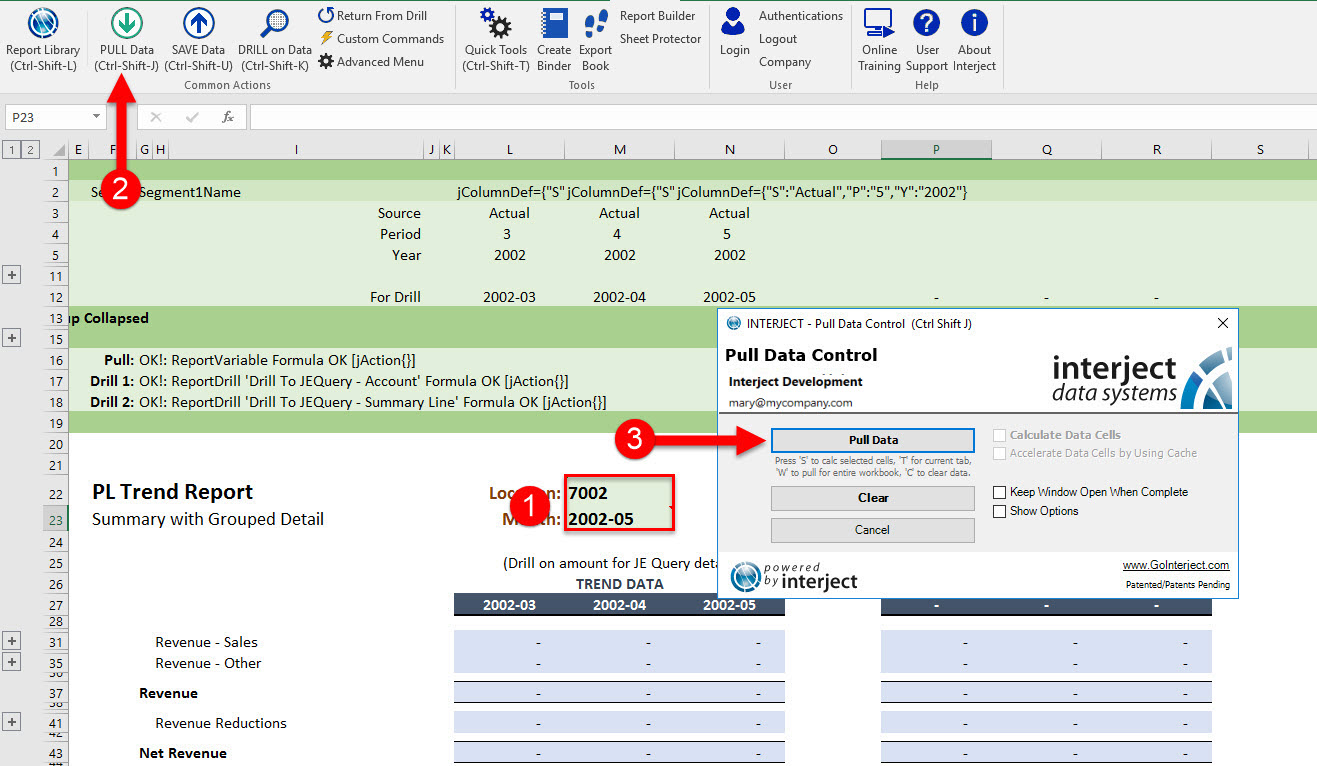
Now input 7002 into Location and 2002-05 into Month. Then Pull the report.
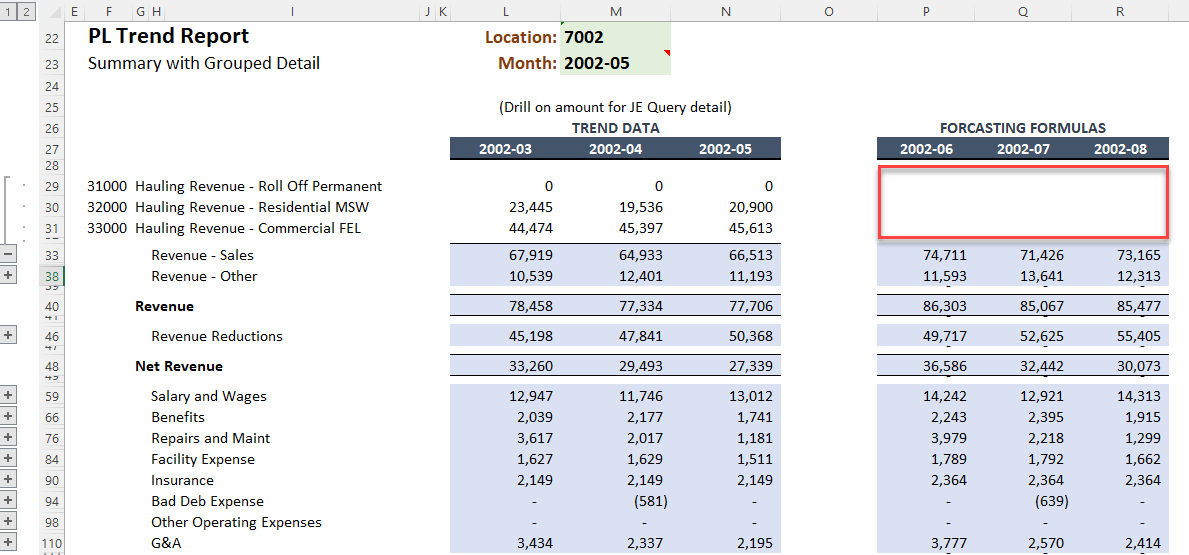
Step 3: Now, with the blank section to the right, we will create a projection based on the previous 3 months.
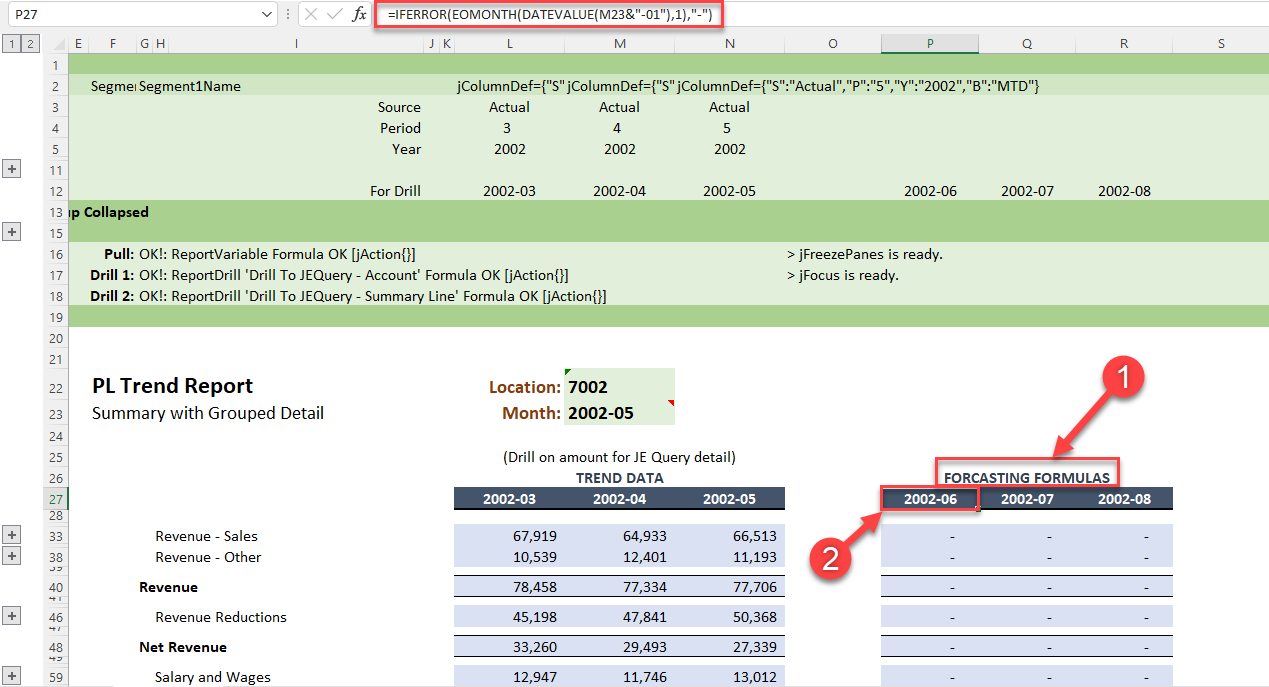
First, in cell Q26, input Forecasting Formulas. Then, edit the formula in P27 to be =IFERROR(EOMONTH(DATEVALUE(M23 &"-01"),1),"-"). The following month formulas are set to use this formula and will update accordingly.
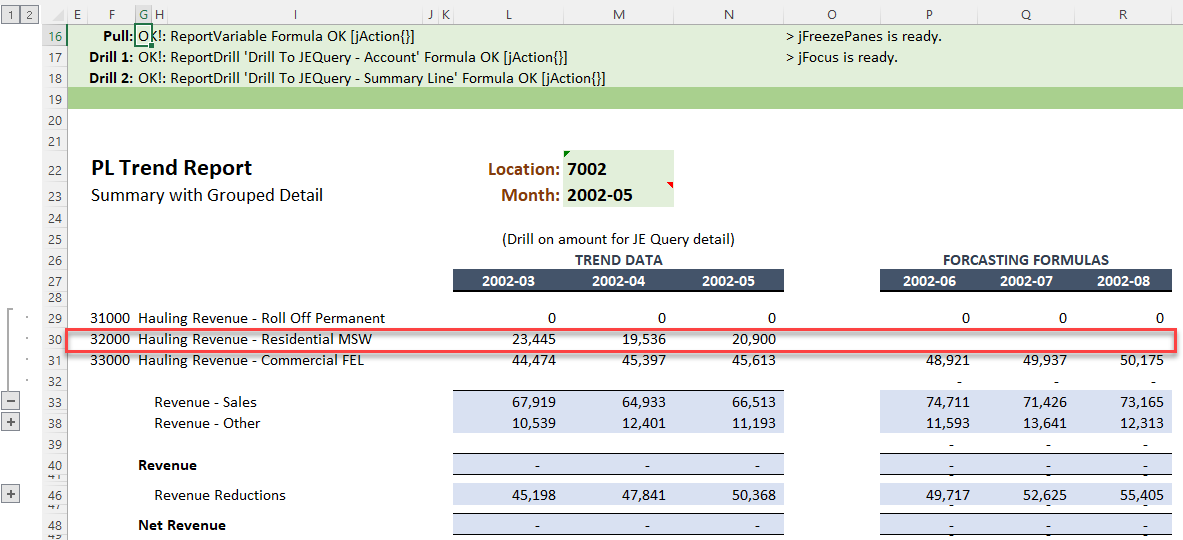
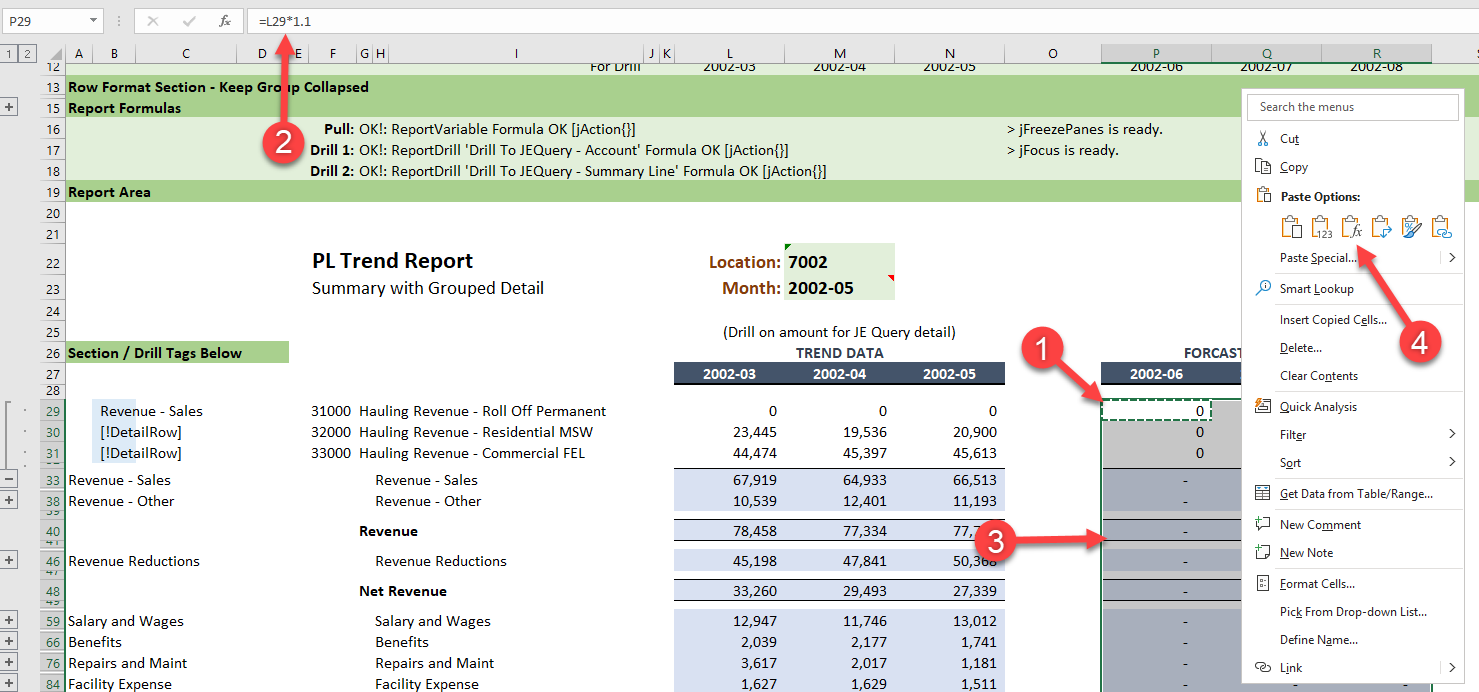
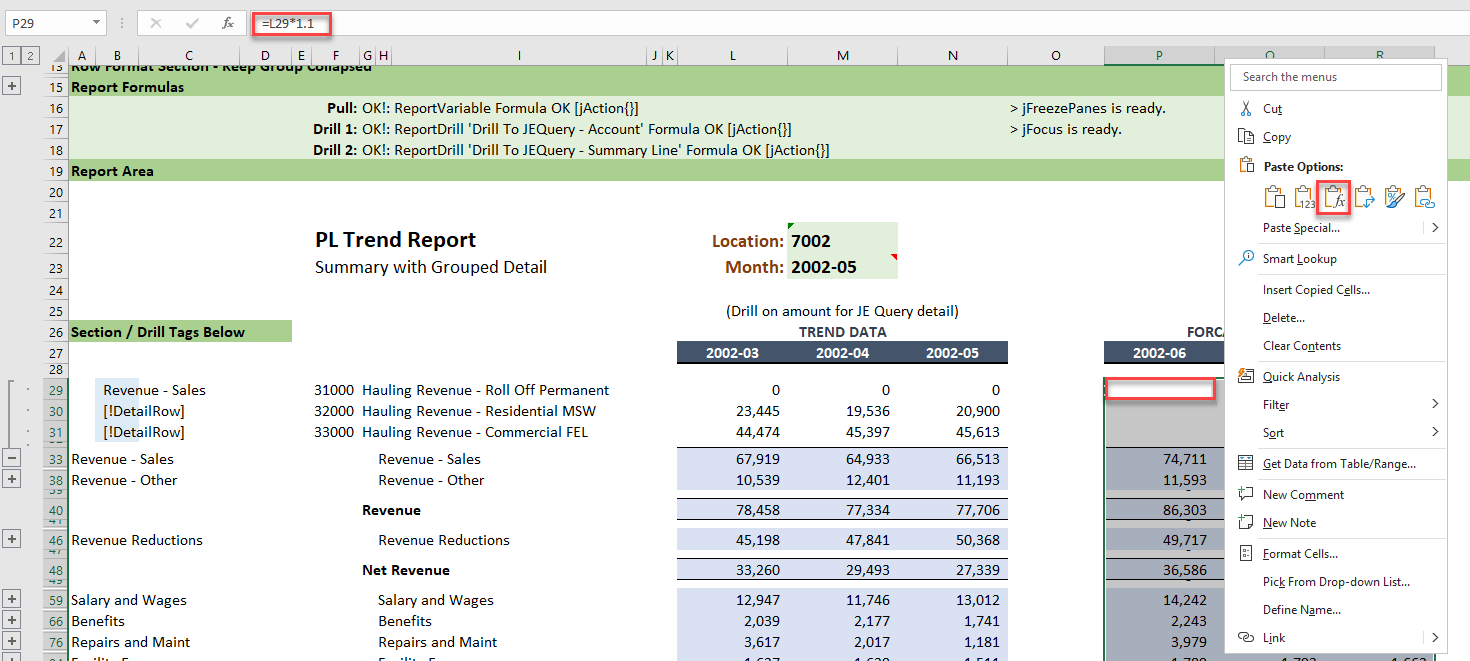
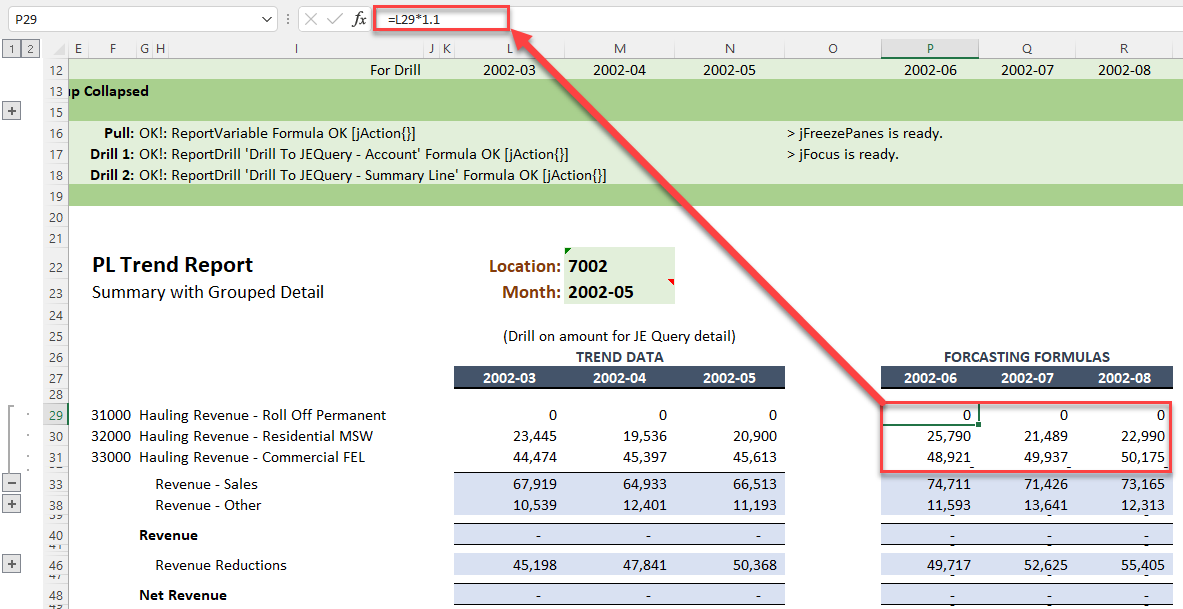
Project a 10% increase to every value. First select cell P29 and input the formula =L29 * 1.10. Copy cell P29 to the clipboard. Next highlight cells P29:R152. Finally, right-click on the area and paste the formulas.
Without RetainedRowColumns
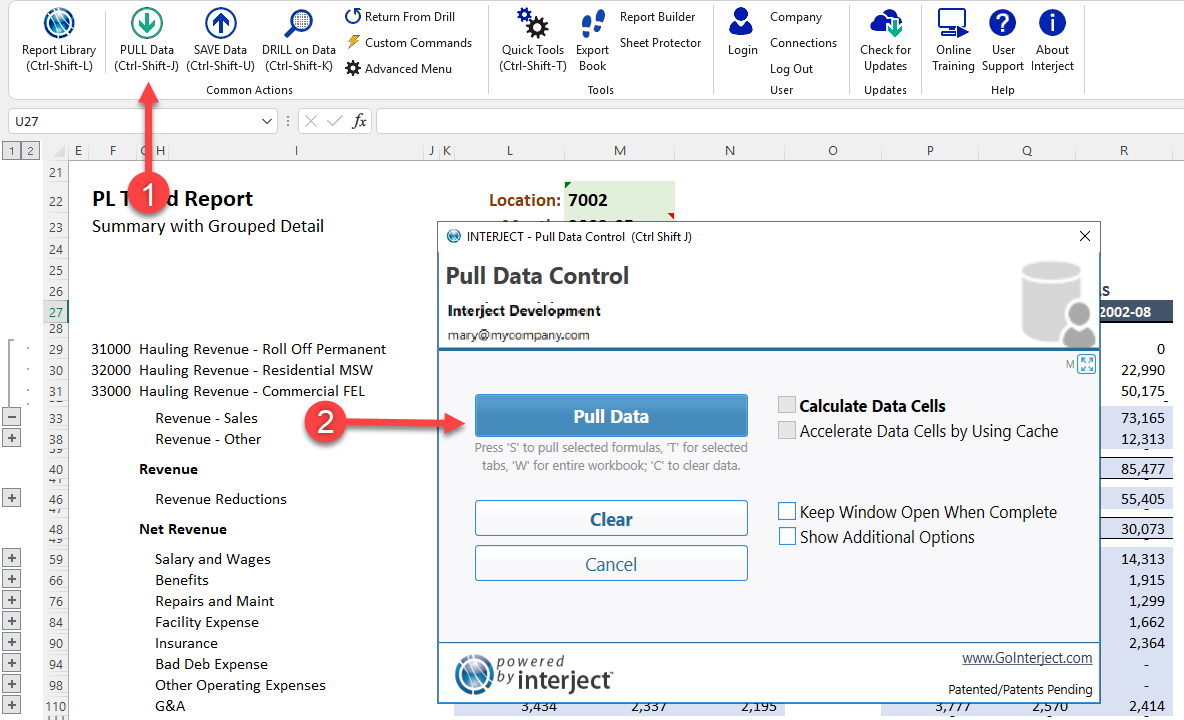
If the account numbers were to change, the 10% increase would no longer be accurate since the data is old. Re-pull the data to update your numbers.
Without using the RetainedRowColumns feature, if your formulas are on the same rows as the data detail rows, the formulas get deleted when pulling updated data. Notice after pulling, the projected increase is deleted:
Note: The reason that some of the rows do not lose their formulas is because they are what are considered summary rows. A ReportVariable() also contains detail rows which are rows that get deleted on a pull or clear.
With RetainedRowColumns
To fix this, use the RetainedRowColumns to retain the rows and your formulas.
Step 1: Start by inputting =L29 * 1.1 into cell P29 again and then copy the formula into cells P29:R152 like before.
Step 2: Next we need to identify the key column(s) that will be used to signify which rows to be retained. Interject will retain any row with a value in any of these columns. Typically you would enter the name or list of names of the key columns. However, in this financial report, the key columns are using the jColumnDef() function. This function creates a composite column key made up of multiple values.
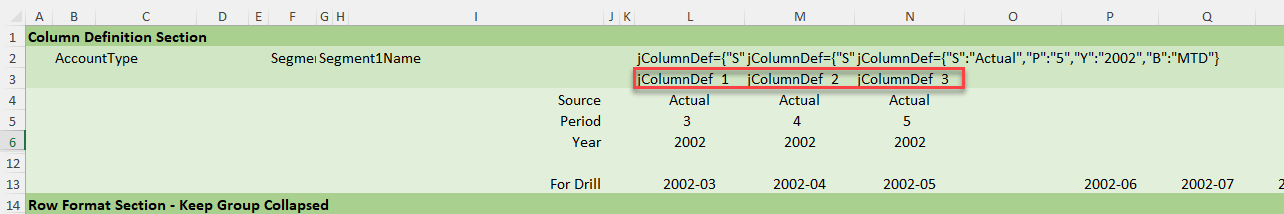
You can still reference jColumnDef columns by using the names "jColumnDef_1", "jColumnDef_2", "jColumnDef_3", etc. To insert these names, you will create a new row that contains these names so you can reference them in the ReportVariable function.
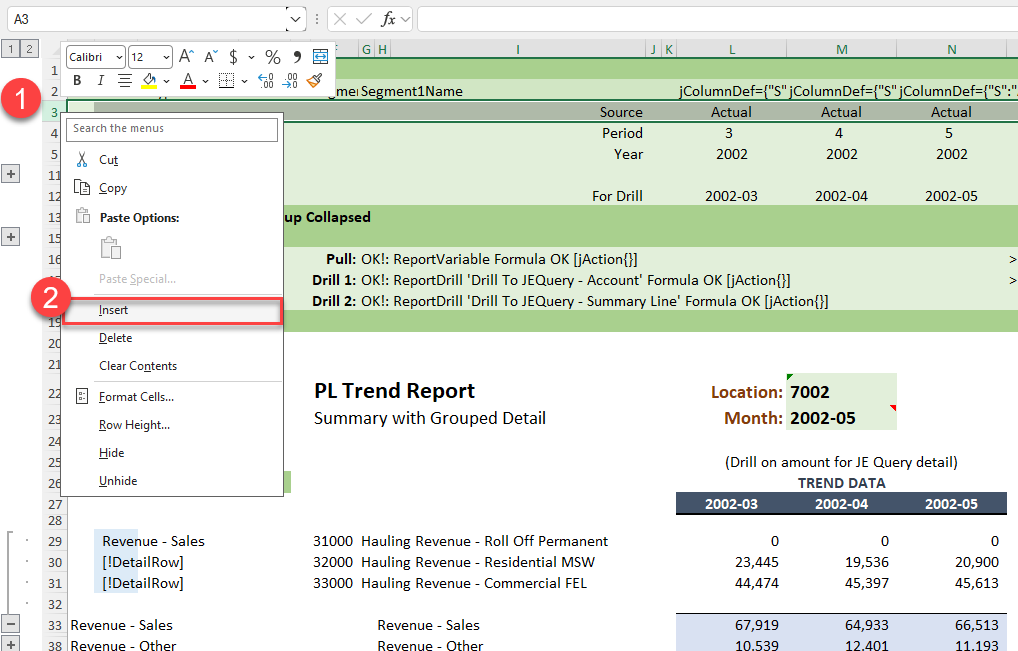
First right click row 3 and click Insert to insert a new row.
Now in L3, M3, and N3, enter "jColumnDef_1", "jColumnDef_2", and "jColumnDef_3" respectively.
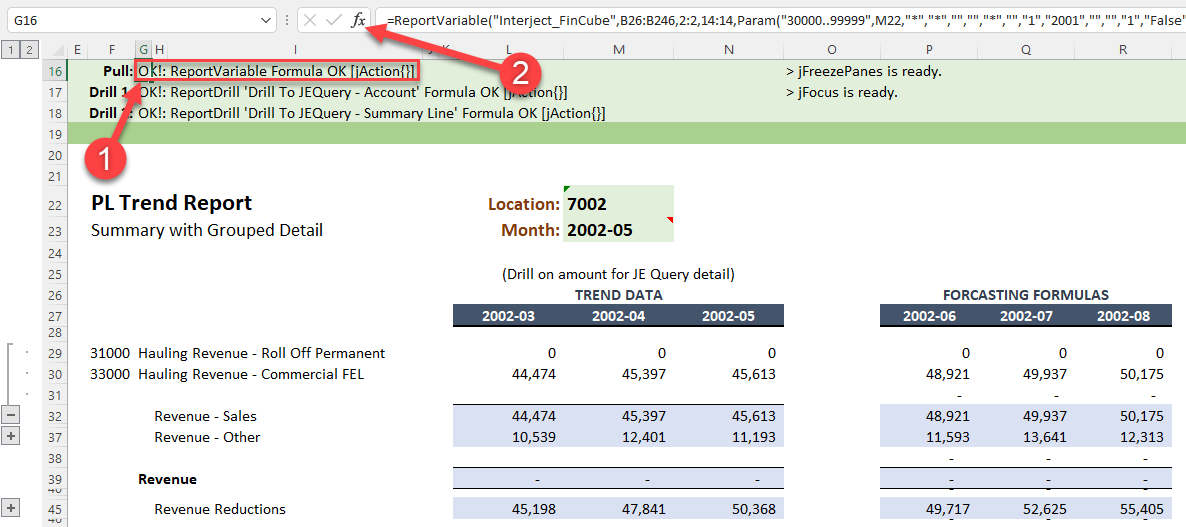
Step 3: Now you will reference these 3 columns in the ReportVariable function. Click on the cell G16, which contains the ReportVariable formula. Now click the fx button to pull up the function wizard.
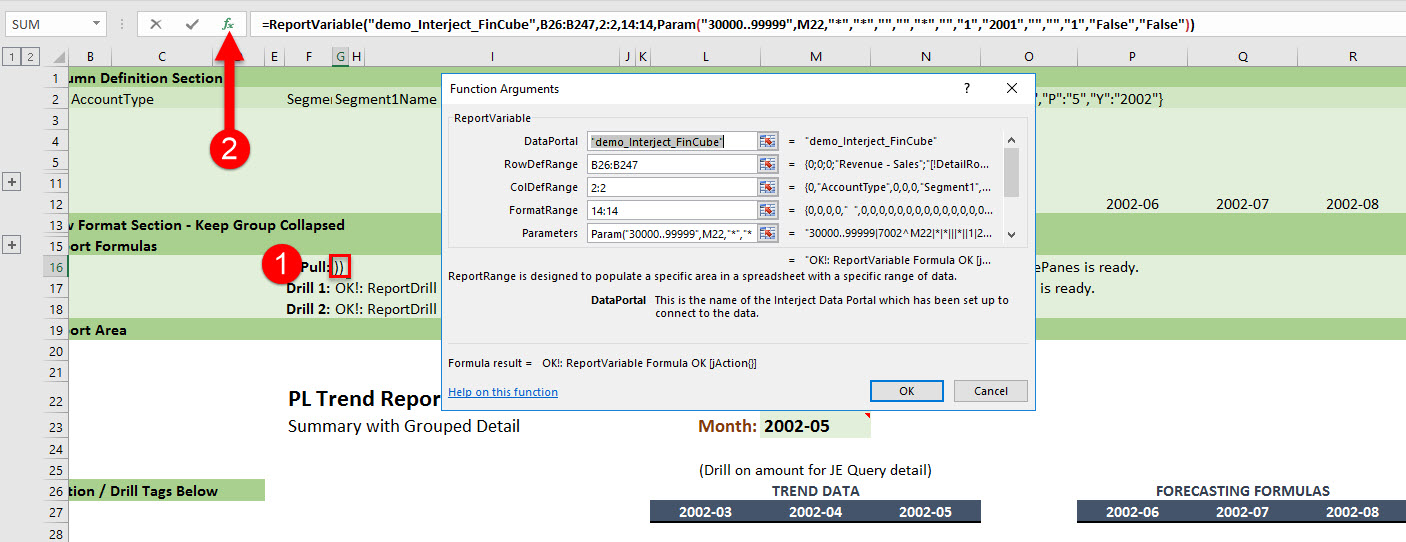
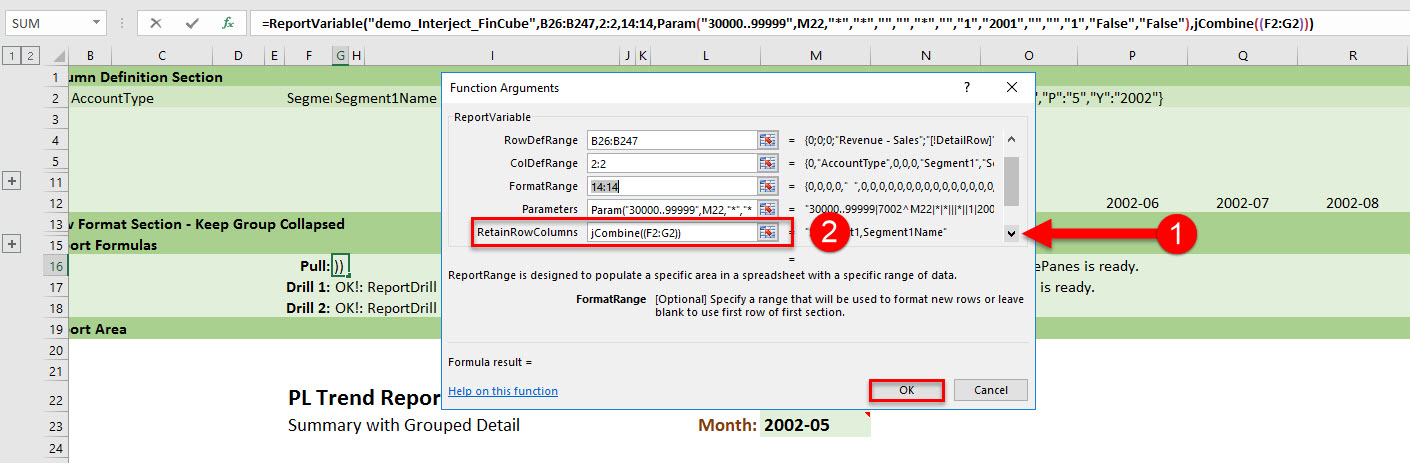
Scroll down to the RetainRowColumns. The RetainRowColumns argument expects a single string of comma delimited names of columns that will be retained after a data pull. Instead of entering the string, the jCombine() helper function is helpful as it will concatenate the column names for us.
Enter jCombine((L3:N3)) in the field. This will retain all rows that have a value in any of these jColumnDef columns.
Step 4: Now, if the data changes again, you need to Pull the report again.
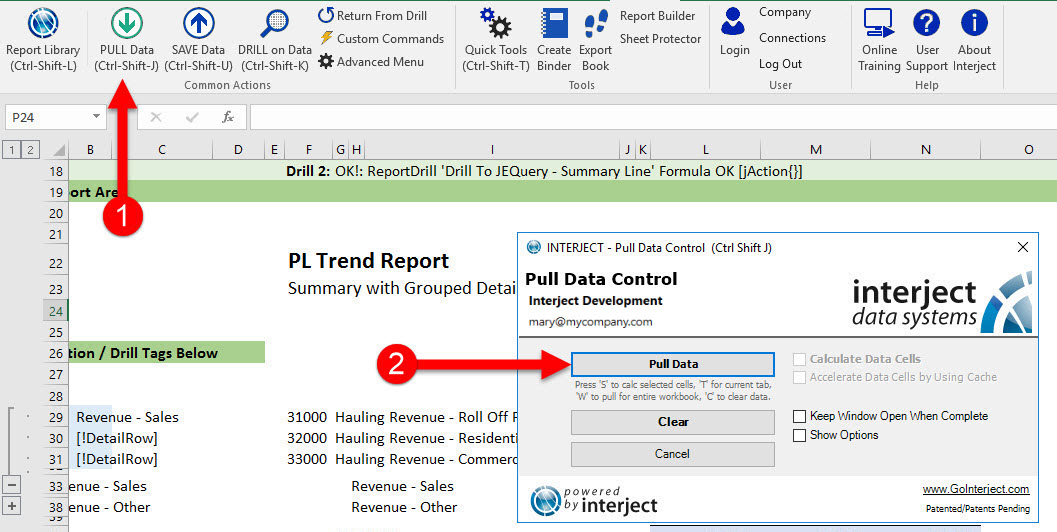
Notice that the formulas are still intact and accurate to the new data.
Insert New Rows Within
Every time you pull data, it will retrieve the most custom data set. Sometimes this means it has to add new rows of data that do not currently exist in the report. When a new row of data has to be added, there are two options: 1) insert the new row at the bottom of the section or 2) insert the row based on the sorting of the key values columns. The default action is to insert the new rows of data at the bottom of the section, since this helps avoid adding the new rows in-between your formulas.
The following will illustrate the difference.
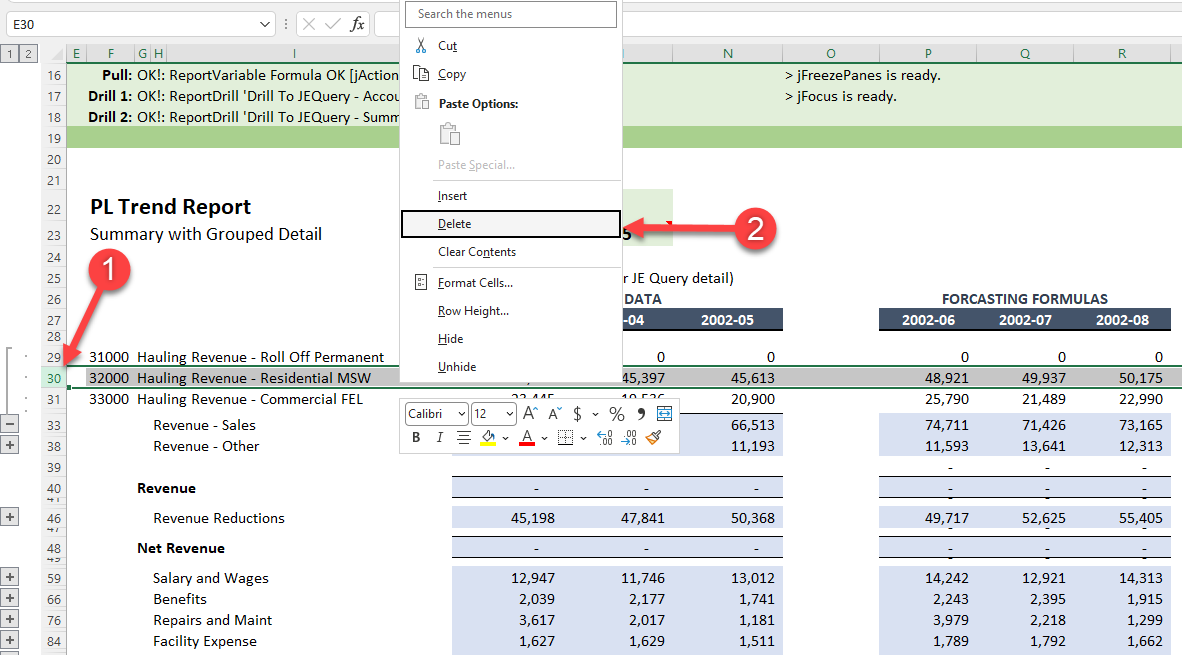
Step 1: Highlight the row with the account 32000 and right-click on it and delete the row.
Step 2: Now pull the data again to add the missing row. Notice two things: 1) the row is added at the bottom of the section (You may need to expand the row height to see it), and 2) the custom formulas are missing from the new row.
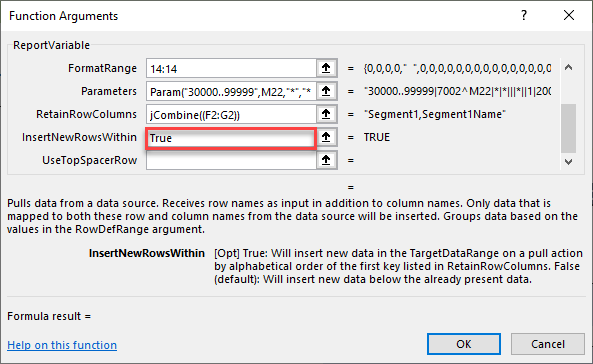
Step 3: To illustrate using the InsertNewRowsWithin, first delete the row again. Click on the cell which contains the ReportVariable() formula and click the fx button to pull up the function wizard.
Scroll down to the InsertNewRowsWithin parameter and enter True and click OK.
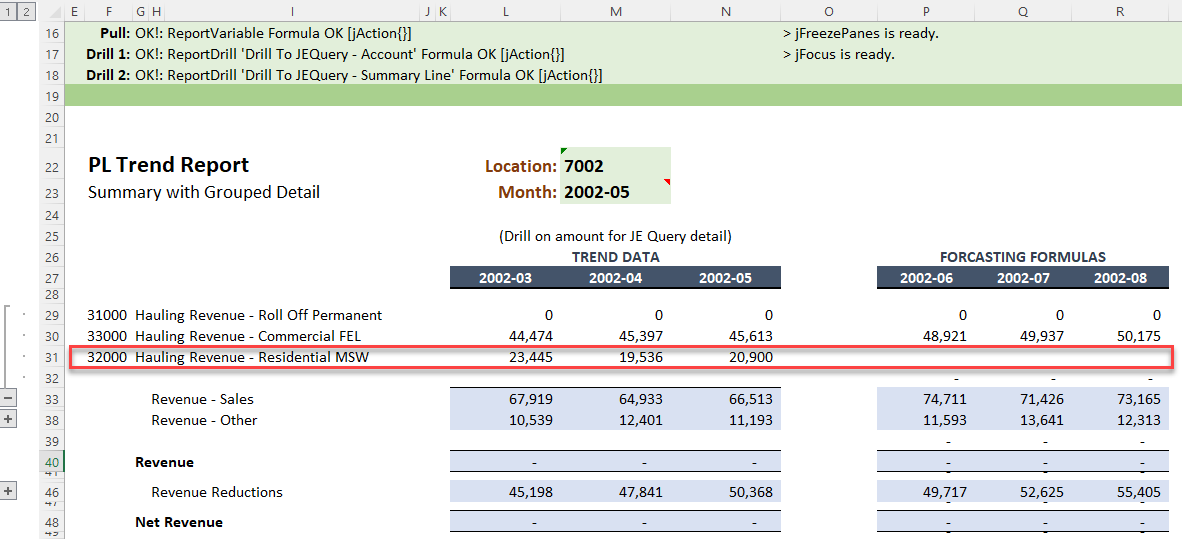
Step 4: Finally, pull the data again and notice the new row is added in sorted order.