Excel Best and Worst Practices
Estimated reading time: 13 minutesOverview
Interject is an add-in that greatly extends the feature set of Microsoft Excel. However, there are still limits within Excel. This section covers considerations related to creating complex or large reports. If not careful, there could be long wait times, overly large files, or other issues that may disrupt the workflow.
Since each worksheet has 1,048,576 rows and 16,384 available columns, there are 17,179,869,184 (17 billion) cells. Add in formatting, complex formulas and conditional formatting, and it is easy to see how such an open design can overtax desktop performance and cause problems.
Excel performance can be affected, depending on the complexity of a report and the Excel features you use. For example, the grouping feature can significantly reduce the amount of data that can be handled practically in Excel. The same is true if there are many complex conditional formats. Even regular formulas can degrade performance. Nested If() functions or using the Ifs() function impact processing if there are many conditions to evaluate.
Think of Excel as a Better Browser
Excel is a terrific and flexible tool, and to make the best use of it in your daily work, think of it less as a database and more as an interface. Instead of importing 500,000 rows into a spreadsheet to support a pivot table or other type of summary report, the Interject platform makes it easier for you to access only the top level of the data you need. When designing a report, it is best to curate the user experience as if you are building a website application. For example, a summary view of 50 records that can drill to additional detail would be more manageable than a long scroll of 100,000 detail records. The example below illustrates this point further.
Example: In the screenshot below, you have a list of 20,000 records. You can filter the data, but there is an easier way.
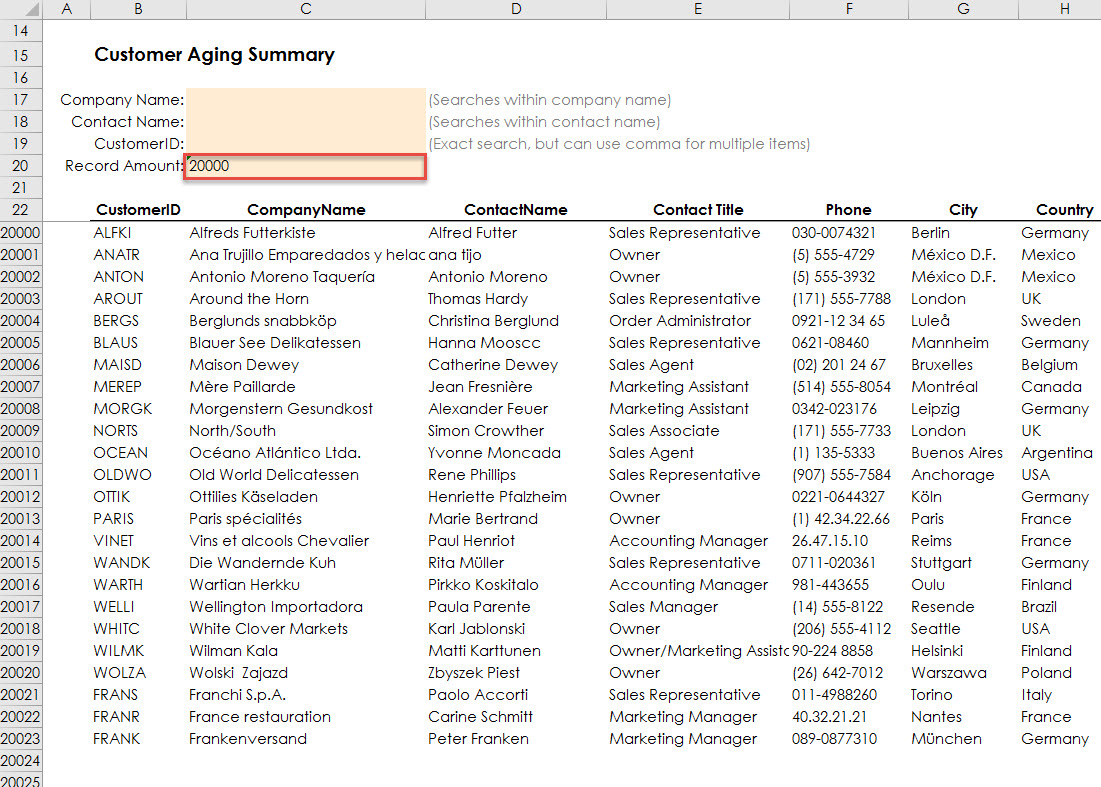
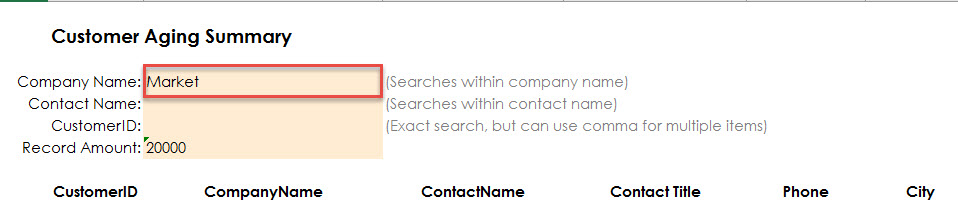
The user can filter the data like in the screenshot below, but there could be an easier way.
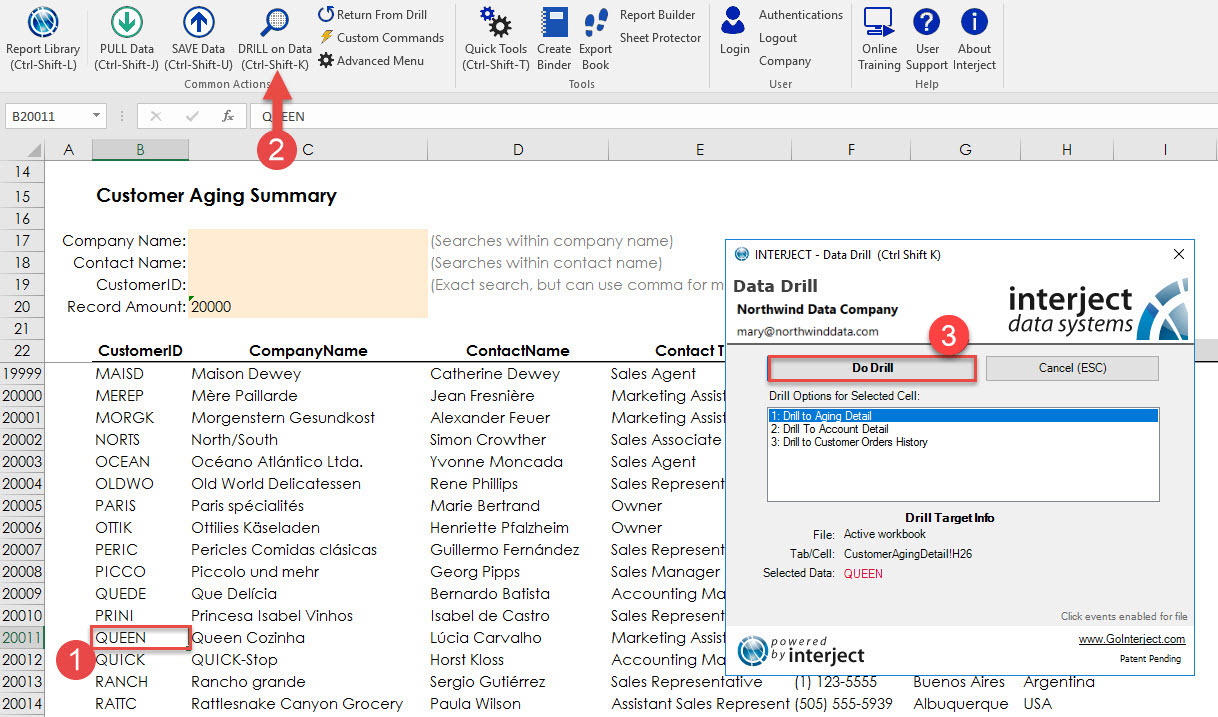
The next screenshot shows an alternative, a drill action to a summary report, created by an Interject developer to give users easier access to viewing the details of the 20,000 records.
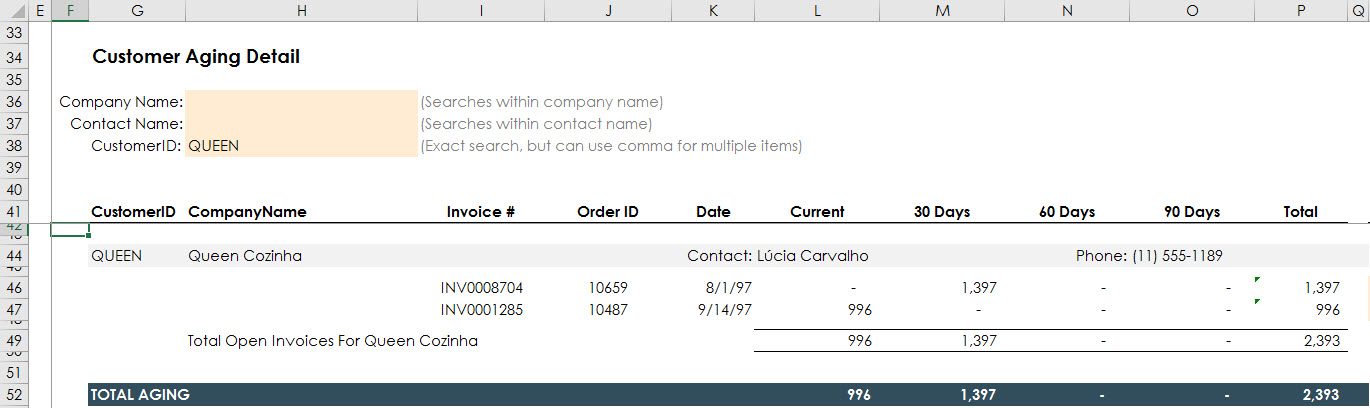
This screenshot shows the summary report, which is a simpler way to find the data meanwhile having a more complex presentation.
Record Counts
Depending on the desktop memory and CPU, it is feasible to import 400,000+ records with Interject if the report is not complex. However, the Interject design is focused on a high degree of flexibility, where the report can be tailored to the user experience. In some reports, displaying 20,000 records is not practical to work with. You may appreciate the smaller row counts when you can drill to the underlying detail when needed. This also speeds up your user experience.
Similar to most website applications, you typically process only a few hundred rows before drilling to additional detail. Consider leveraging the same workflow design experience as you would when designing a website application. This helps create an interface where your users have the ideal size of data to work with.
Empty Cell Formatting
Sometimes in the course of report building, your report may collect empty cells that still carry formatting. Over time this issue can grow and cause performance issues. Excel has a feature that can optimize your report by removing the formatting of these unused cells. The "Check Performance" feature is found on the "Performance" tab of the Excel Ribbon. For more information on this feature, see Cleanup Cells.
Conditional Formatting
Conditional formatting can not only be difficult to manage because the formulas are not as visible, but it also adds processing for Excel. To reduce the complexity of conditional formatting configure the formula logic in the spreadsheet with a True/False result. Then you can use A5 = True as a simple formula in the conditional formatting to define the required formats. This best practice helps performance by applying conditional formatting to an organized structure of ranges instead of disparate ranges that may duplicate calculations. It is beneficial to keep the conditional formulas organized. It is also helpful to use them in moderation. Conditional formats are not initially visible, so using them can quickly get out of control.
Limiting the Ranges Used in Interject Report Formulas
In most reports, selecting the entire row for Column Definitions in ReportRange() is fast and easy. However, when using larger, more complex reports, it is better only to include the columns needed for the report.
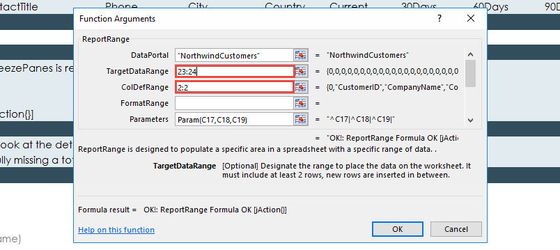
In the below example, ReportRange() selects column definitions and a target range that selects the entire row.
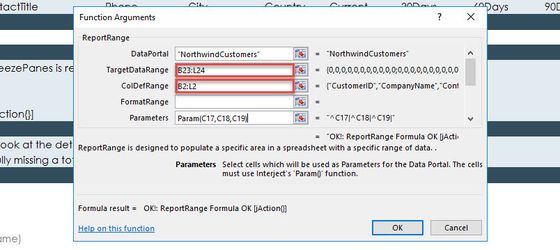
The next example shows the same report, but only the impacted columns are included in the column definitions and target range. This is more efficient. However, keep in mind the argument for ReportRange(), UseEntireRow is set to False. By setting to True, it converts the ranges to entire rows.
 )
)
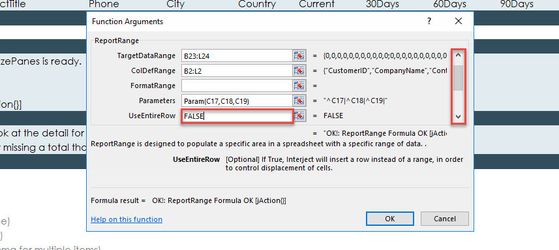
Here you will use the scroll bar in the function wizard to alter the UseEntireRow parameter.
Watch for the Last Row and Last Column
Sometimes developers accidentally use the last cell of the 1,048,576 rows that Excel provides or write a value in the last of the 16,384 columns that is also available. When this happens, the range in use expands to a large range of cells that uses more memory and expands the work area, which can hinder performance. To improve performance, delete all rows and columns beyond the reporting area.
Images
Images can quickly increase the size of an Excel report. If images must be included in a report, you can compress them to 96ppi by selecting the image, clicking the "Picture Format" tab on the Ribbon, and selecting "Compress Pictures." From here, you can select the compression rating and whether to apply the compression to the selected image or all images.
Alternatively, you can set the default compression rating for all newly inserted images as explained on the Microsoft Support Site.
File Type
The old Microsoft Excel type .xls does not compress the data in the report using saving so this type of file will be much larger. Always use the xlsl or xlsm file type for your reports.
The Microsoft binary file (xlsb) type will further reduce the file size of your report. However, there are some limitations: 1) The file may be a security risk as you will not know if it contains macros. 2) You cannot make changes to the Excel Ribbon while a binary file is open. 3) Spreadsheet programs other than Excel may not be able to open the binary file.
Pivot Tables
Pivot tables will save the source data with the file in addition to the file contents, making the file much larger then necessary. You can reduce the file size by selecting not to save the source data and instead, simply choose to refresh the data when opening the file. Both these options are available by right clicking the pivot table, click "PivotTable Options", and then select the "Data" tab.
VBA Macros
Using VBA (Visual Basic for Applications) can bridge a special feature or process gap in a report, but it is important to use VBA sparingly and to avoid adding to the resources needed for processing spreadsheet reports and using applications. VBA can add to maintenance requirements over time, and it can be hard to control versions when users copy reports to their local drives. It is possible to leverage VBA with Interject. These are special use cases that hopefully will become obsolete as more features are added to Interject. We welcome any questions in this area so that we can add more functionality to limit the need for VBA.