FinCube - The Financial Cube
Estimated reading time: 32 minutesOverview
The FinCube is a single Data Portal that supports a wide variety of reporting needs. It is included as part of the Interject Financials for Spreadsheets application, and many of the segments can be customized for specific needs. In some ways, when combined with Interject, this Data Portal report feature works like a pivot table with increased format and structure control. It is more manageable when scaling to hundreds of users.
Typically, FinCube is used for consolidated financial reports, including monthly trends, YTD comparisons, budgeting templates, and simple balance inquiries. Because of its scalability, FinCube may support up to 70% of a company's financial reporting formats.
Segment Filter Options
Before each parameter is described that can be used in a spreadsheet report, it is important to discuss the common filters that can be used. The first 12 segments share a similar data filtering syntax. The following options are explained using an Account and Period segment.
Filter for multiple items: For account, use 21200,21300 to filter for both accounts 21200 and 21300. For Period, use 1,2,3 to represent quarter 1. There are groupings already set up for quarters, so Qtr1 also works (more detail follows). Using the comma, each addition is considered an OR , which means each element is not mutually exclusive. Every new element added with a comma will add more data to the filter.
Filter for a range of items: For account, use 21000..22000 to filter for all accounts in that range. The same is true for periods, such as 1..3.
Filter for multiple ranges: Combine both #1 and #2 above and expand the filters, such as 21000..22000,30000..32000. This will filter for both ranges noted.
Filter by excluding items: In some cases, it may be easier to use a range and exclude a few items. With account, use 21000..22000 , then exclude account 21500 using the notation 21000..22000,!21500. The exclamation excludes that element. A range may also be excluded using 21000..22000,!21050..21060.
Filter using wildcards: Use wildcards, such as *** or **? , to find matches for filters. For example, noting 21* will retrieve all accounts beginning with 21, such as 21000 to 21999. Using 21?00 as the filter will retrieve accounts like 21000, 21100, 21200, and 21300. These wildcards can be used together with the methods noted in #1, #3, and #4 above. For example 2,09,!*08 would return all accounts starting with 2 and any accounts ending with 09 but exclude accounts that end with 08.
Filter with Groups: Groups are an important feature that make filtering easier and more manageable. The management of groups will be covered in a different page, but they are defined as a text string representing a filter. For example, instead of using a filter for 21000..22000 , set up a group called Accounts Payable to represent that filter. And if you set up a group for the filter 30000..32000 , and call it Long Term Liabilities , you can use a filter like Accounts Payable, Long Term Liabilities to get the defined accounts. There are preset groups for the Segment 9–Period parameter for Qtr1, and more can be added for monthly periods. The exclude option in #4 above can also be used, such as when you want to see Revenue accounts but exclude Intercompany clearing accounts. This could be noted as Revenue,!Intercompany.
Data Portal Parameters
The table below explains each of the available parameters of the FinCube Data Portal. The example column shows what the typical segment signification, but note that these can be configured differently for every Interject installation.
| Parameter Name | Example | Description |
|---|---|---|
| Segment 1 | Account | This parameter can be used for filtering as noted in the above section. |
| Segment 2 | District | This parameter can be used for filtering as noted in the above section. |
| Segment 3 | System | This parameter can be used for filtering as noted in the above section. |
| Segment 4 | SubSystem | This parameter can be used for filtering as noted in the above section. |
| Segment 5 | Adjustments | This parameter can be used for filtering as noted in the above section. |
| Segment 6 | This parameter can be used for filtering as noted in the above section. | |
| Segment 7 | Company | This parameter can be used for filtering as noted in the above section. |
| Segment 8 | Currency | This parameter can be used for filtering as noted in the above section. |
| Segment 9 | Period | This segment is locked to represent a period (a month). It can be 1 through 12 or YTD1 through YTD12. Groups can be used to define Quarters. |
| Segment 10 | Year | This segment is locked to represent a year |
| Segment 11 | Version | This segment is locked to a version. Versions are used to track changes that may occur to a budget or projection source over time. If configured, filters such as BOD..V7 could be used to filter the data for changes that occurred from the version that was approved by the Board of Directors to Version 7. |
| Segment 12 | Source | Segment 12 is locked to a source, which represents Actual, Budget, Projection, and other comparable financial sources. As data is imported into Interject, sources can be setup for segmenting data. Segment 12 can also be used to separate out Actuals, which may be posted account balances and other types of entries unposted or considered proforma. |
| SegmentNumForRowDefs | This parameter is used only when the Interject report function using the FinCube Data Portal has Row Definitions in a report. Row Definitions creates separate subtotal sections, such as Labor and Benefits in a spreadsheet report. Each of these sections could be collapsed to show the totals and then expanded to show all the account details. Financial reports normally have 20 to 50 subtotal sections. If using groupings to define what a subtotal section will include, like Labor = 50000..52999 and Benefits = 53000..53200 , you can setup the Row Definitions using these groups. However, without the parameter SegmentNumForRowDefs being setup, the FinCube Data Portal will not know which segment our groupings relate to. So if our Accounts are set to Segment1, SegmentNumForRowDefs must be set to 1. In most cases subtotals are based on Accounts, but that is not necessary. If our subtotal sections are going to use groups related to a line of business, and our segment for line of business is Segment3, SegmentNumForRowDefs must be 3. |
|
| ShowCredit | This parameter can be used with the ReverseSigns parameter to show the required sign for an account segment. It will change the sign (+/-) displayed on accounts. For example, Revenue naturally shows as a credit in the general ledger data since it is a credit account. However, Revenue should show as a positive in a profit and loss report. See the example chart below. | |
| SkipLive | This is a special Interject feature allowing reports to access live data for the current open month being closed. If set to False, the amounts provided are based on the last scheduled or manually triggered import. If this is configured in your Interject installation and SkipLive is set to True, the FinCube Data Portal will directly access the current open month balances in real time. This features gives users up-to-the-second data while limiting the server resources needed to present live data during a financial close. It is a significant productivity improvement compared to data warehouses or data-marts that can only provide data updated on a set schedule. |
|
| ReverseSigns | This parameter can be used in conjunction with the ShowCredit parameter to show the required sign for an account segment. By setting to True it will reverse the signs of the amounts returned. See the example chart below. | |
| LastRun | This is an output parameter places in the spreadsheet the report's last run date and time. This will use the timezone settings of the windows session. | |
| TimeLineFrom | If configured, this will allows users run reports showing changes over time based on imported intervals. Using this feature shows the report as it would have been run the previous week. Alternately, it will show changes occuring in the last 12 hours. If this from date and time parameter is omitted, it defaults to 1/1/1900. | |
| TimeLineTo | This parameter works with TimeLineFrom. If omitted it is defaulted to through the current week. |
Examples using Show Credits and Reverse Signs Parameters
The Show Credits and Reverse Signs parameters work together to provide the output required in presenting positive or negative numbers for financial statements. The chart below shows + or - to signify output. The yellow row shows how Assets, Liability, Equity, Revenue, and Expense are naturally recorded in a general ledger. For example, Revenue is always negative by default, but is normally presented as a positive number in a profit and loss report. For certain reconciliations reports, these credit accounts may be specifically set up to show as a negative.

Available Columns for the Data Portal
The FinCube Data Portal is unique because of its wide array of column options included in the column definitions of Interject report formulas. There are three types of columns: Segment, Group, and Amounts.
Segment Columns
Segment columns relate to Segments 1 through 8 and any other groupings setup for the segments. In the configuration of Interject segments, assigned names can be used as columns. For example, Acct (short for account) may be assigned to Segment 1 and Dist (short for district) can be assigned to Segment 2. In this case both Acct and Dist can be used in columns to show the level of detail required. If only Acct is included in the column, the amounts will be summarized by Acct. If both Acct and Dist are included as columns, then both are shown, and the amounts are summarized by Acct and Dist. This will work for a combination of the first 8 segments.
In addition, the name of the segment may also be noted by adding Name as a suffix. For example, AcctName will show the account name.
Group Columns
When Groups are set up for a segment, like Acct, they can also be used as columns. It is important to understand what a Segment Group is and which ones can be used. Groups are simply a text phrase assigned to a filter, the same filters explained above. A simple Group for Acct may be Product Sales (defined as accounts 32000…34000 ) and Consulting Sales (defined as accounts 34001…35000 ). Groups can also contain other Groups. For example, a Group called Revenue could contain different Group, like Product Sales and Consulting Sales.
When Group names are used as columns, the column will summarize the amounts by the Groups it contains. So, in the above example, if Revenue is used as column, then groups Product Sales and Consulting Sales would each show on a row, and the amounts would be summarized at that level.
In a coming release, there are two new features coming to Groups. A sort order will be assigned to a group so users can control the order. In the above example, Product Sales will be listed before Consulting Sales , since they would normally show in alphabetical order. A future release will also support a group name to add more descriptive names to groups. Currently, Groups are a single text string and may not be text desired in a report. In the above example, you could set up Sales_Prod and Sales_Cons as the Groups, and then make Product Sales and Consulting Sales the Group names. In using the parent group Revenue as the column, if you added Name to the end of the Group, like RevenueName , you would get the more descriptive names Product Sales and Consulting Sales in the report, instead of Sales_Prod and Sales_Cons.
Amount Columns
There are three methods to specify amount columns in the column definition of a report formula. These include CYA, ACT, and jColumnDef.
CYA Column Notation
This notation is deprecated but is still supported. Since these notations are relative to a year, it is important to specify the year in the above noted parameter Segment 10 - Year. By noting a year, CYA defines what the current year is. CY is for current year, LY is for last year, and so on.
| CYA Notation | Description |
|---|---|
| CYA1 through CYA12 | Current Year actuals for a specific month. The number in the suffix specifies the month. |
| CYAYTD1 through CYAYTD12 | Current year actuals for year to date. The number in the suffix specifies the month. |
| CYA_TOT | This is another to total a year. It is same as using CYAYTD12, which returns a total from January to December. |
Other prefixes can be used in place of CYA:
| Prefix | Description |
|---|---|
| LYA | Last year actual |
| L2A | 2 years ago actual |
| L3A | 3 years ago actual |
| L4A | 4 years ago actual |
| NYB | Next years budget |
| CYB | Current year budget |
| LYB | Last years budget |
Options for Forecast
This notation is more complex, because forecasts may need to retain not only the month forecast but also store when the forecast was completed. For example, you might forecast March twice in a year, first in January and again in February, then compare how that forecast changed over time.
Forecast notation can be set up to handle these changes over time. For example, above, CYFJan3 would represent the first time March was forecast. CYF means current year forecast, Jan signifies the projection was made in January, and the 3 notes the month from when the projection was completed, such as in a rolling forecast.
Forecasting March again in February, the notation would be CYFFeb2. Forecasting March again during the month of March, the notation would be CYFMar1.
The examples below may help clarify.
| CYA Notation | Description |
|---|---|
| CYFJan1 | Forecast for January: Current year forecast completed in January for the first month of the projection period (January). |
| CYFJan2 | Forecast for February: Current year forecast completed in January for the 2nd month in the projection period (February). |
| LYFSep3 | Forecast for November: Last year forecast completed in September for the 3rd month of the period (November). |
| Special Suffixes for Unposted Amounts | If configured you may be able to use the Unposted or WithUnposted suffix to notations like CYA5 to see the amounts in our journal entries that are not yet posted. |
| CYA_wUnposted | Shows the total of posted and unposted amounts for March of the current year |
| Special consideration for Staged journal entry Amounts | If configured you may be able to show staged journal amounts not yet uploaded to the ERP. Examples below. |
| CYA3_Staged | Shows only the totals for the staged amounts for March of the current year. |
| CYA3_WithUnpostedAndStaged | Show the total of posted, unposted, and staged amounts for March of the current year. |
ACT Column Notation
This notation is one step beyond CYA, since it can also be relative to a month and not just a year. ACT can make it easier to build and maintain monthly review reports because the columns specified are all relative to the month and year filter.
Since these notations are relative to a year and a period, it is important to specify the year and period in the parameters Segment 9–Period and Segment 10–Year and link them to a cell in the spreadsheet report. For the table below you can consider Mar 2017 the specified period.
| ACT Notation | Description (Assume Mar 2017 is the specified period) |
|---|---|
| Act | The current-month actual for Mar 2017. |
| Bud | The current-month budget for Mar 2017. |
| Proj3 | The suffix for projection can be difficult to understand. Proj3 notes the projection for Mar 2017, when Mar was the third month of the projection period. This means the projection for Mar that was done in January. |
| Proj2 | The projection for Mar 2017 done in Feb 2017. |
| Proj1 | The projection for Mar 2017 done mid-month, Mar 2017. |
| Projections may have several versions (sometimes called editions). | Projections for Mar 2017 in the second week of Mar are the initial projection. Additional projection revisions may be in the 3rd and 4th week of Mar before the month closes. The notation below adds a suffix of Edition, which can be used in the report to specify a particular week's changes. |
| Proj1Edition1 | Same as Proj1, the initial projection. |
| Proj1Edition2 | Shows the changes made in the 3rd week projections. |
| Proj1Edition3 | Shows the changes made in the 4th week projections. |
| Proj1All | The summation of Proj1Edition1, Proj1Edition2 and Proj1Edition3 |
| Special Suffixes for Unposted Amounts | If configured, you may be able to use the _Unposted or _WithUnposted suffix to notations like ACT to see the unposted amounts in our journal entries. |
| Act_Unposted | Shows only the totals for the unposted amounts. |
| Act_WithUnposted | Shows the total of posted and unposted amounts. |
| Special consideration for Staged journal entry Amounts | If configured, you may be able to show staged journal amounts that are not uploaded to the ERP yet. Below are examples. |
| Act_Staged | Shows only the totals for the staged amounts. |
| Act_WithUnpostedAndStaged | Shows the total of posted, unposted, and staged amounts. |
jColumnDef() Column Notation
The jColumnDef() notation is the most recent addition to the column options and is the most flexible and intuitive in use. Instead of using a single text string to represent an amount, like CYA1 or Act, you can use the jColumnDef() function containing arguments for each of the 12 segments noted in the above Data Portal parameters. In this way, you can specify each component separately and more clearly. jColumnDef() arguments are essentially an additional filter level for each column you want to show.
It is important to emphasize that jColumnDef() goes beyond a source (Actual, Budget, fcast1 to fcast12), a year, and a period alone. These are the same segments (9, 10 and 12) that earlier notations (CTA and ACT) can only specify. jColumnDef also supports the remaining 12 segments and each can support the same filter options and groups noted above for Data Portal parameters The result is a highly flexible method to create columns.
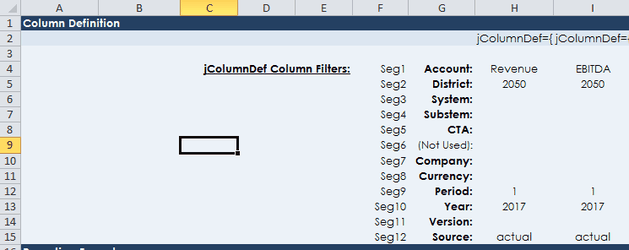
The illustration below shows an example. In cells H2 and I2, the jColumnDef() function is entered into the column definition row instead of CYA1 or Act. The jColumnDef() function argument references the cells below it (rows 4 through 15) that notes all the segment options. In this example, the columns will return the Jan and Feb of 2017 actuals, since Period, Year and Source are the only segments used.
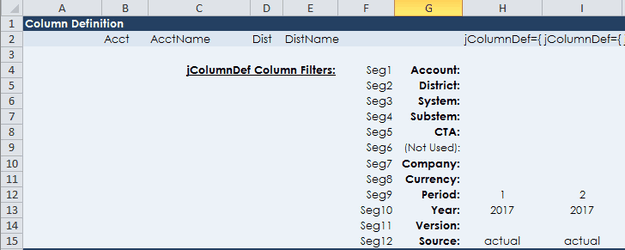
In the following example, you are using more of the segments. The columns were changed so both are for Jan 2017, but the first column is now specified to all revenue for district 2050. the second column is specified to show EBITDA for the same district. Using segment groups provides multiple ways to define a column.